Terminal overview
The Terminal page — one dense screen with prices, the order-flow chart, fired signals, macro series, news, your portfolio and two AI tools — its five layouts, what each access level sees, and how to read the status bar.
The Terminal is a second way into TapeHawk, at /terminal. Where the chart gives one market all the screen, the Terminal puts the markets side by side with everything around them: a price table, the same order-flow chart, the alerts and signals that fired, macro figures, headlines, your portfolio and an AI assistant. It is built for scanning — pick a market in one module and every other module follows it.
It has no site menu: the bar across the top is its own, and the TapeHawk logo in it is the way back to the home page. You open it from Terminal in the Product menu of the site.
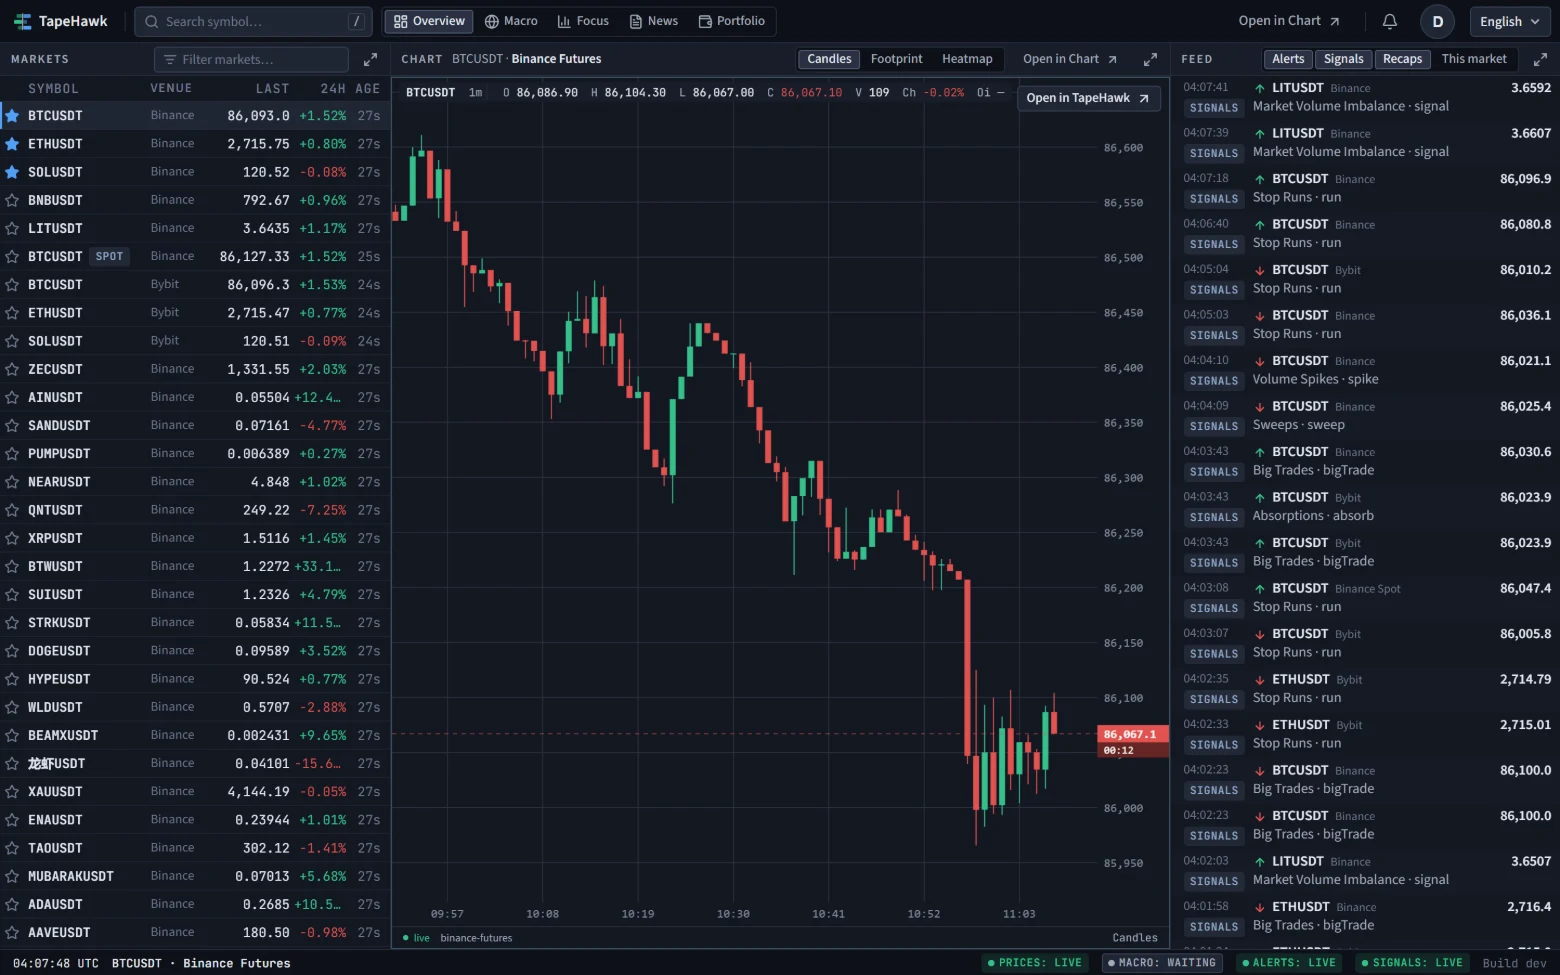
One selected market
Every module that is about a market is about the selected market: the chart, the feed's This market filter, the news, the AI assistant and the AI desk. You change it by clicking a row in the price table, clicking an alert or signal in the feed, or searching in the toolbar — see Markets and watchlist. The status bar at the bottom always names it, with its venue, because the same symbol on two venues is two different markets.
The toolbar
From left to right:
- the TapeHawk logo, which leaves for the home page;
- the symbol search, to jump to any market;
- the layout switch — the five layouts below;
- Open in Chart, which opens the full chart on the selected market and venue;
- the alert bell, the account menu (or Log in) and the language switch. They are the same bell and menu as on the rest of the site, so an alert that fires shows here as it does anywhere else — see Alerts.

The five layouts
Each layout is a fixed arrangement of three modules, chosen from the toolbar. There is no dragging and no resizing.
| Layout | Modules, left to right | For |
|---|---|---|
| Overview | Markets · Chart · Feed | Find a market, read its chart, see what just fired |
| Macro | Macro · Chart · AI assistant | The chart against the macro backdrop, with the assistant to ask about either |
| Focus | Chart · Watchlist | One large chart, your starred markets beside it to switch |
| News | Markets · Chart · News | A market and what the press is saying about it |
| Portfolio | Portfolio · Chart · AI desk | What you hold, the chart of the selected market, and the AI desk's view |
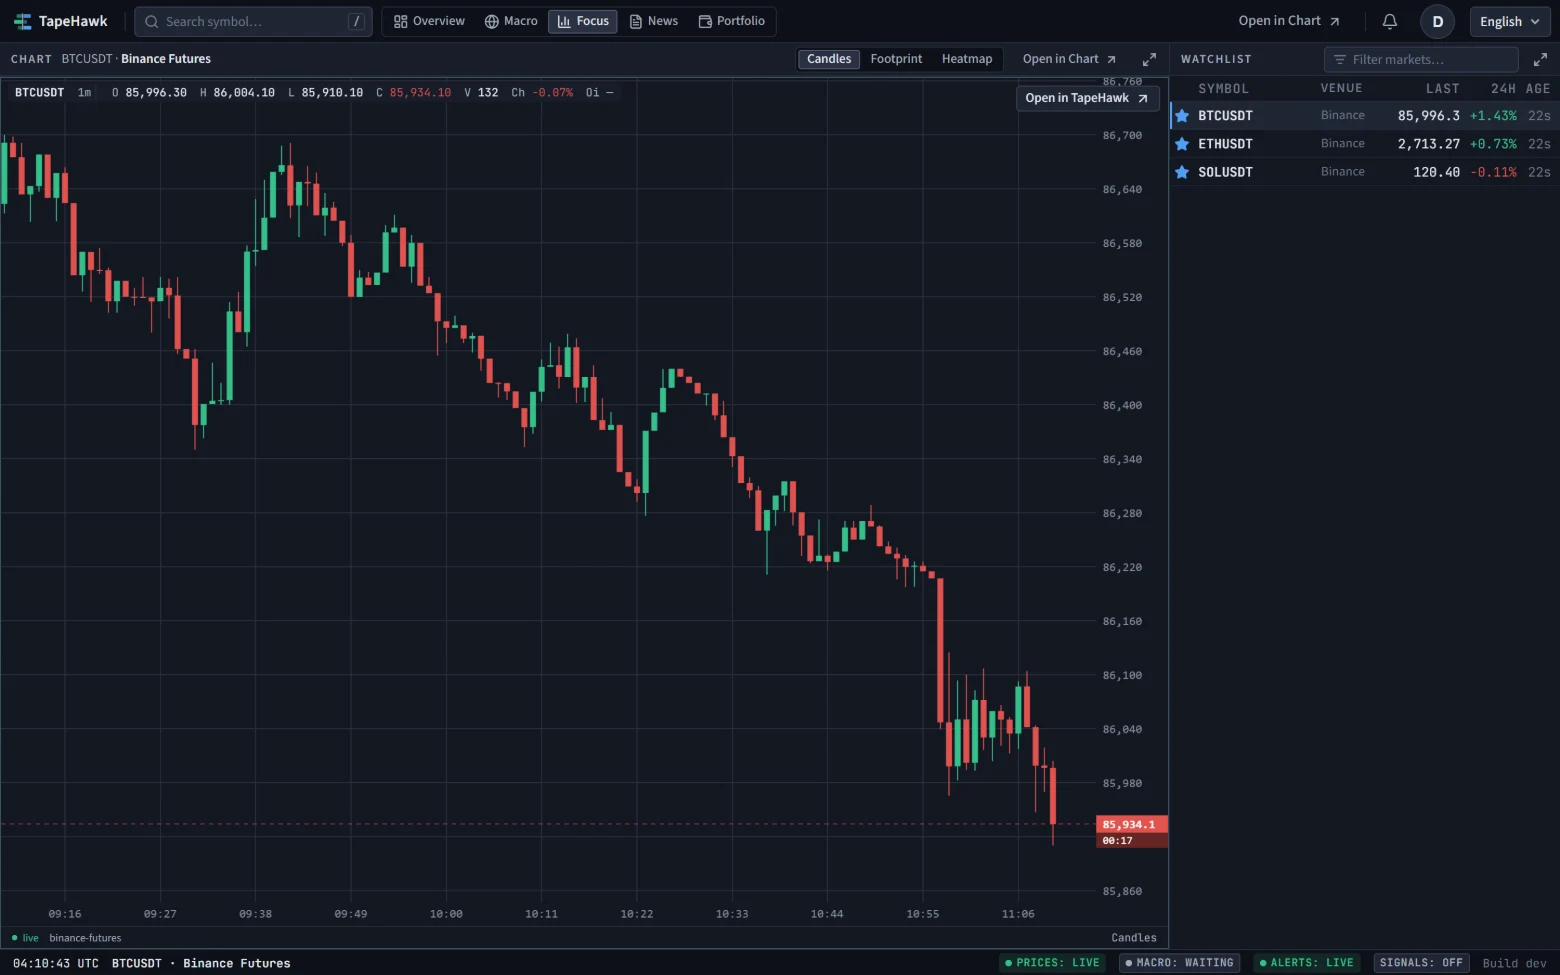
Each module has its own page: Markets and watchlist, Chart, Feed, Macro, News, Portfolio, AI assistant and AI desk.
Maximizing a module
The button at the right end of a module's title bar makes that module fill the whole grid; the same button, now labelled Restore layout, puts the layout back. The other modules are hidden, not closed — the chart does not reload when you come back to it. Picking another layout restores the grid.
What each access level sees
Anyone can open the Terminal. What a module shows depends on who is looking. A confirmed account is one whose email address has been confirmed — see Account.
| Module | Visitor | Account, email not confirmed | Confirmed account |
|---|---|---|---|
| Markets prices | ✓ | ✓ | ✓ |
| Chart | ✓ | ✓ | ✓ |
| Macro | ✓ | ✓ | ✓ |
| Feed — recaps | ✓ | ✓ | ✓ |
| Starring markets, Watchlist | ✓ | ✓ | |
| Feed — your alerts and fired signals | ✓ | ||
| News, Portfolio | ✓ | ||
| AI assistant, AI desk | ✓ |
A module you cannot use does not disappear: it says what to do — a link to sign in, or that your email needs to be confirmed. The two AI modules and the portfolio are tied to the confirmed account because each question or run uses a paid model and the portfolio is stored on your account.
What the Terminal remembers
The layout, the selected market and the maximized module are kept in the browser, so the Terminal opens the way you left it. They are not stored on your account: another browser or device starts from the Overview layout on BTCUSDT. If a remembered market is no longer listed, the Terminal shows BTCUSDT instead.
The prices in the Terminal use the up and down colours you chose on the chart — see Colors and settings.
When a module has nothing to show
Every module says which of four things is true instead of leaving a blank box:
- Loading… — the first answer has not arrived;
- Nothing to show yet, or a sentence naming what is missing — there is nothing to list;
- Could not load — the request failed. A Retry button appears in the title bar;
- a Delayed banner with the time of the last update — what is on screen is the last good answer, kept until a new one arrives.
A quiet market and a broken connection look different here on purpose.
The status bar
The strip along the bottom shows, left to right, the time in UTC, the selected market and its venue, then four data sources, then the build the page is running.
| Source | What it tracks |
|---|---|
| Prices | The price table's poll |
| Macro | The macro series from their three publishers |
| Alerts | The live connection that delivers your alerts |
| Signals | The signals feed |

Each carries one word:
| Word | Meaning |
|---|---|
| live | Current |
| delayed | The last refresh failed or was refused; what is shown is older. In Macro, a publisher has not updated lately |
| down | Nothing usable: no prices published, the macro source never loaded, the alert connection is closed, or the signal engine is not running |
| off | Not in use: the source needs a confirmed account (Alerts and Signals for anyone else), or its module was on screen and you switched to a layout without it |
| waiting | No answer yet — the first one has not arrived, or the source's module has not been on screen since you opened the Terminal. In the Overview layout, Macro reads this way: nothing there asks for macro figures |
Point at a source to see when it last updated, in UTC.
A tab in the background stops refreshing and catches up as soon as you return to it.
On a phone
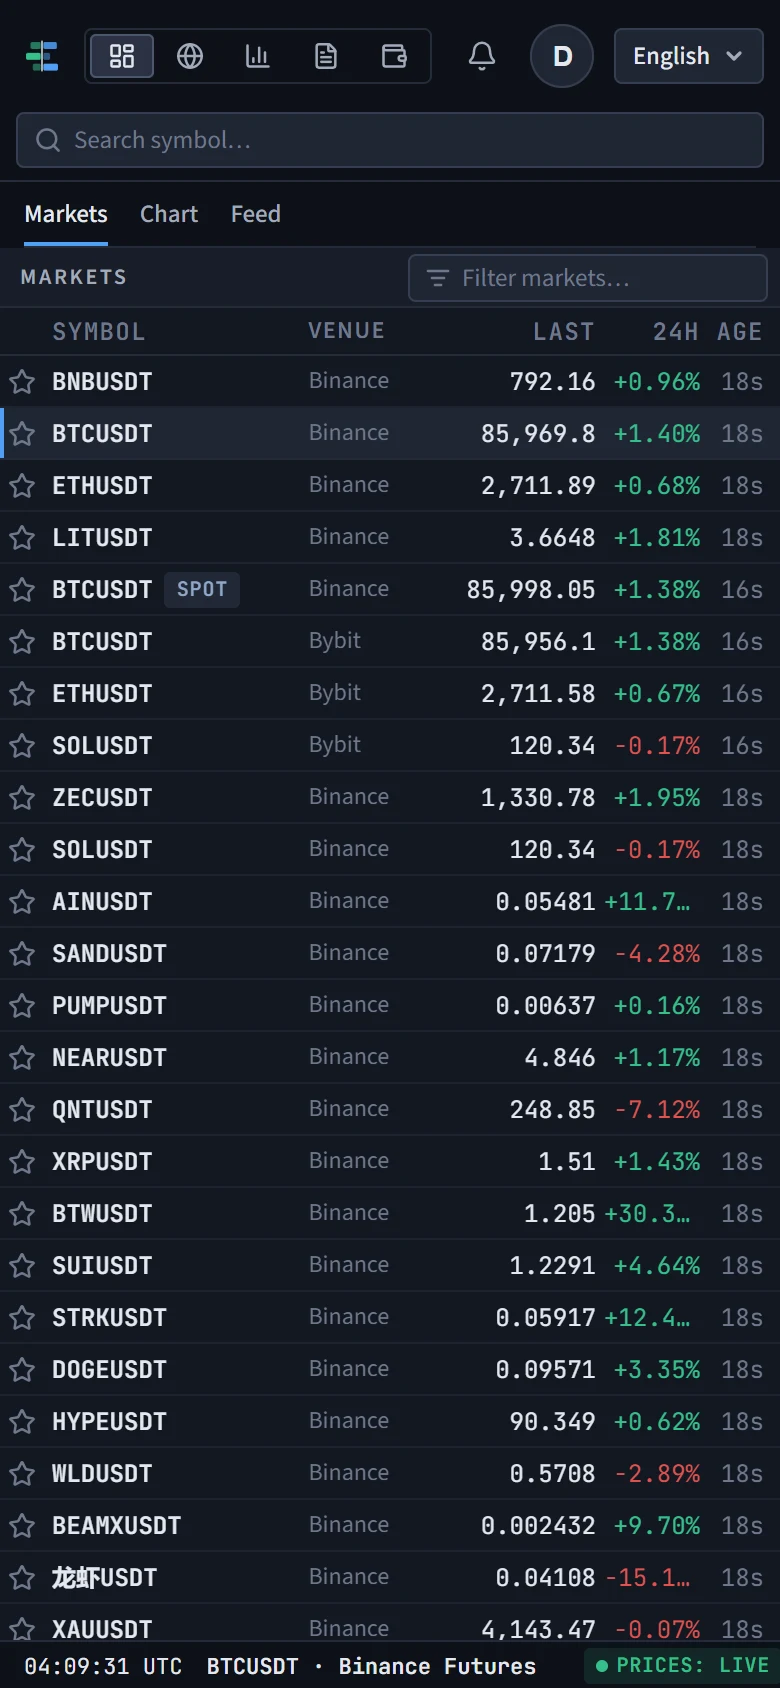
Below a tablet's width the grid becomes one module at a time, with a strip of tabs — one per module of the layout — across the top. Every module of the layout stays loaded behind the tab you are not looking at, so switching is instant and the chart does not reload. The layout switch, search and the rest of the toolbar work as on a larger screen.
Journal and stats
The Summary tab of the paper-trading panel — the session's numbers in R, the distribution of results, the list of closed trades, and exporting the session as CSV.
Markets and watchlist
The price table, the watchlist of starred markets, and the toolbar's symbol search — how to find a market, how fresh its price is, and what a missing price means.