Journal and stats
The Summary tab of the paper-trading panel — the session's numbers in R, the distribution of results, the list of closed trades, and exporting the session as CSV.
The Summary tab of the paper-trading panel covers the closed trades of the session: its numbers, the spread of its results, the list of trades, and the export. An open position is not counted until it closes.
Results are in R — what the trade stood to lose at its stop when it opened (see Why a stop is required). Results and the figures built from them are after fees; MAE and MFE are price moves, before fees.
The numbers
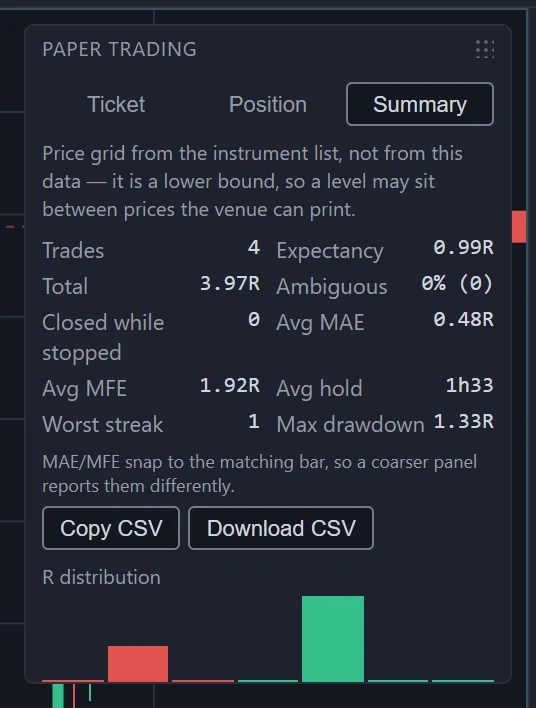
| Stat | What it is |
|---|---|
| Trades | How many trades have closed. |
| Expectancy | The average result per trade, in R. Above zero, the way you traded made money on average; below, it lost. |
| Total | All results added up, in R. |
| Ambiguous | The share of trades whose exit was ambiguous — one bar reached both the stop and the target, and the stop was taken — with the count after it. |
| Closed while stopped | How many trades you closed by hand while matching was stopped, at the matching panel's last price rather than a live one. |
| Avg MAE | How far trades went against you before they closed, on average, in R. |
| Avg MFE | How far trades went in your favour before they closed, on average, in R. |
| Avg hold | How long trades stayed open, on average, in replayed time: minutes, or hours and minutes. |
| Worst streak | The longest run of losing trades in a row. |
| Max drawdown | The deepest fall of the running total from its highest point so far, in R. |
Reading them together:
- Expectancy is the number to judge a way of trading by. It does not depend on position size, so a session with large and small trades still adds up.
- A high ambiguous rate means many results were decided against you by a bar too coarse to tell what came first. The fix is a finer matching panel, not a different entry — see How a fill is decided.
- Trades closed while stopped ended at a price that may already have been stale. The more of them, the less the total says about the prices you could actually have had.
- MFE well above your results means trades went your way and gave it back: the target may be too far, or a manual exit too late. MAE close to 1R on winning trades means they nearly hit the stop first.
MAE and MFE depend on the matching panel
The tab notes MAE/MFE snap to the matching bar, so a coarser panel reports them differently. TapeHawk tracks the highs and lows of the matching panel's bars while a position is open, and cannot see inside a bar. A coarse bar can count range from before the position opened — when a finer panel was moving the replay on inside it — and a bar's range lands on whole bars rather than on the moment of the entry or exit, so the same trade can show a larger or a smaller MAE and MFE on a 5m panel than on a 1m panel. On the bar that closes the trade, only the fill price counts. Compare these two numbers only between sessions matched on the same timeframe.
R distribution
R distribution is a bar chart of how many trades ended in each whole-R step. Each column is named by
the low end of its step and counts the trades from there up to the next whole R: the column under +0 holds trades from
0R up to +1R, and the column under −2 those from −2R up to −1R. A trade stopped out for a little more than 1R once
fees are counted therefore lands under −2. The two end columns collect the rest: <−2 every trade below −2R, and
≥+3 every trade from +3R up.
The shape shows how the expectancy was reached. Many small losses and a few large wins, and many equal results either side of zero, can have the same average.
The trades table
Below the chart, each closed trade has a row, in the order they closed. Before the first trade closes the tab says
No closed trades yet.
| Column | What it shows |
|---|---|
| Side | Long or short |
| Entry | The entry price |
| Exit | The exit price |
| R | The result in R, after fees |
| MAE / MFE | How far the trade went against you and in your favour, in R |
| Fill | How certain the exit was |
The badge on each row, with the explanation that appears when you point at it:
- exact — Only one of stop/target was reachable inside this bar. A manual close while matching runs is exact too.
- ambiguous — Both the stop and the target were reachable inside this bar — the bar cannot say which came first, so it was resolved against you.
- gap — The bar opened past the level: a stop fills at the open, a target at its own price.
- stopped — Closed while matching was stopped: the exit took the last price the matching panel showed, and other panels may already have been past it.
Export
Nothing in a paper-trading session is saved, so exporting is the only way to keep one. Two buttons under the numbers turn the whole session into CSV, a format any spreadsheet opens:
- Copy CSV puts it on the clipboard. If the browser refuses access to the clipboard, the panel says Could not reach the clipboard — use Download instead.
- Download CSV saves it as
paper-session.csv.
The file starts with a header row, then one row per closed trade, with these columns in this order:
| Column | Content |
|---|---|
id | The trade's number in the session |
side | long or short |
qty | The quantity |
entry_time | The opening time of the bar the entry price came from, in UTC |
entry_px | The entry price |
entry_badge | Always exact: an entry fills at a price that printed |
stop_px | The stop when the trade closed |
target_px | The target when the trade closed; empty when it had none by then |
exit_time | The opening time of the bar the exit price came from, in UTC |
exit_px | The exit price |
exit_reason | stop, target or manual |
exit_badge | exact, ambiguous, gap, or stale for a manual close while matching was stopped |
risk_per_unit | The distance from entry to stop when the trade opened |
fee | Both legs' fees, in the symbol's quote currency — USDT on BTCUSDT |
pnl | The result in the quote currency, after fees |
pnl_r | The result in R, after fees |
mae_r, mfe_r | MAE and MFE, in R |
hold_ms | Time between the entry and exit bars, in milliseconds |
After a blank line comes the summary, as metric and value rows: trades, total_r, expectancy_r, ambiguous,
ambiguous_rate, exits_while_stopped, avg_mae_r, avg_mfe_r, avg_hold_ms, worst_streak and max_drawdown_r.
Numbers are written at full precision, so adding up the pnl_r column matches the session's total. Rates are
fractions: an ambiguous_rate of 0.25 is 25%.
Placing trades
The order ticket, why every order needs a stop, the reasons an order is refused, managing the open position, moving its levels on the chart, and the fees charged.
Terminal overview
The Terminal page — one dense screen with prices, the order-flow chart, fired signals, macro series, news, your portfolio and two AI tools — its five layouts, what each access level sees, and how to read the status bar.