Portfolio
Enter what you hold and see its one-day value at risk, Sharpe ratio, volatility and how the coins move together — what each figure means, the window it is measured on, and why a holding can be left out.
The Portfolio module keeps a list of what you hold and measures it against a year of history. It is in the Portfolio layout, beside the chart and the AI desk, and needs a confirmed account: the list is stored on your account. Anyone else sees a link to sign in, or a note to confirm their email.
You enter the holdings by hand. TapeHawk does not connect to an exchange or a wallet, and never sees your balances unless you type them here.
Entering holdings
Press Add holdings the first time, or Edit afterwards. The editor lists one row per holding:
- Type in the Add a market box at the foot of the list —
BTC,ETH— and pick a market from the suggestions. A market already in the portfolio is not offered again. - Enter the amount of coins you hold in that row —
0.5for half a bitcoin — not a dollar amount. The cross at the end of a row removes it. - Press Save. Cancel leaves the list as it was.
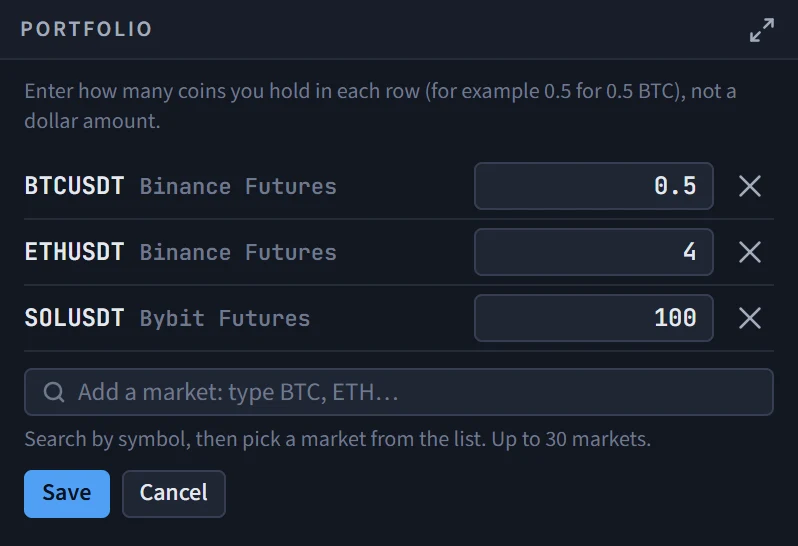
A portfolio holds at most 30 markets. Saving is refused, with the reason beside the row, for an amount that is not a positive number, a market listed twice, or a market that is not in the instrument list.
The figures
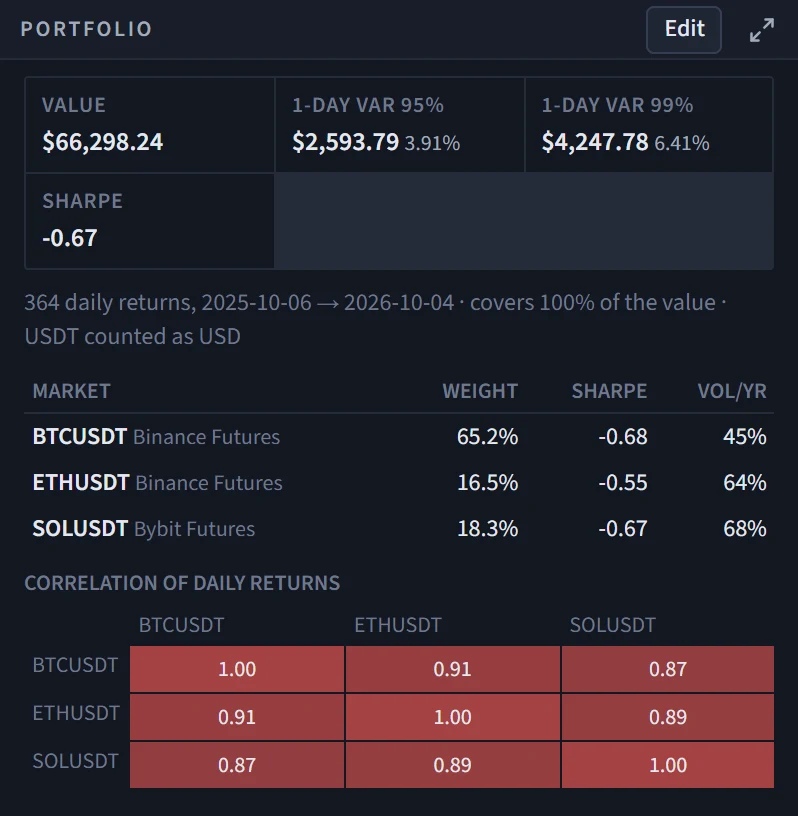
Once saved, the module measures the portfolio on daily closing prices and shows:
| Figure | What it means |
|---|---|
| Value | Your amounts at the latest closed daily price. It does not move with the live price |
| 1-day VaR 95%, 1-day VaR 99% | The one-day loss that the worst 5% — or worst 1% — of the days in the window reached or exceeded, had you held today's amounts through them. In dollars, and as a share of the value |
| Sharpe | Return per unit of risk over the window, annualised over 365 days, against the 2-year US Treasury yield as the risk-free rate |
Point at a value-at-risk or Sharpe figure for a one-line explanation.
The method behind them is historical, not forecast: value at risk is read straight off past days and says nothing about days worse than any in the window, and a Sharpe ratio describes the past window, not the next one.
The window
Under the figures a line states exactly what they were measured on — in the form N daily returns, first day → last day · covers X% of the value:
- the days are those on which every holding included traded and had a daily return. It reaches back up to a year, and is shortened by the youngest holding;
- covers is the share of your value that the measured holdings make up. Below 100% means a holding was left out — see below;
- if the Treasury yield could not be read, the line adds that the risk-free rate was unavailable and the Sharpe ratio uses 0;
- prices in USDT are counted as US dollars.
With fewer than 30 common days, the module shows no totals and says how many days it needs: a figure computed on a short history would look exact and mean little.
One line per holding
Under the totals, each holding has its Weight (its share of the value), its own Sharpe, and Vol/yr — the annualised volatility of its daily returns.
A holding can be left out of the measurement, and the row says why instead of quietly making the portfolio smaller:
- Listed N days ago — too short, left out — it has less than 30 days of daily history;
- Daily prices unavailable — left out — the daily prices could not be loaded;
- No longer listed — left out — the market has been delisted.
Correlation
With two or more holdings measured, a grid shows the correlation of daily returns between each pair, from −1 to 1. Positive values — coins that tend to move the same way — are tinted in the down colour, because they are the ones that do not spread risk: a portfolio of coins that rise and fall together is one bet, however many rows it has.
When the figures do not load
While the measurement runs the module says so; if it fails it says Could not compute the figures with a Retry button. The holdings you saved are not affected.
News
Crypto headlines from five public news feeds — how to switch between the selected market's and everyone's, what a row shows, and what the module says when an outlet is late.
AI assistant
Ask a question in words about the selected market and get an answer built from recorded data — how the numbers in an answer are produced, what you can ask, the allowance, and what the error messages mean.