Chart module
The order-flow chart inside the Terminal — what it shows, which chart types it can switch between, what it leaves out compared with the full chart, and how to open the full chart on the same market.
The Chart module is in every layout. It is the order-flow chart of the selected market on the venue of the row you chose — click a Bybit row and the chart is Bybit's, not Binance's. It follows the selection: click another market anywhere in the Terminal and the chart changes to it.
What it is
The module is the real chart, framed — the page /chart in its embedded form — so what is drawn is exactly what the full chart draws for the same market and chart type. It shows one panel and has none of the full chart's surroundings: no toolbar, no sidebar, no drawing tools, and it neither loads nor changes your saved layouts.
The panel keeps its own legend and its connection badge, so a chart that has stopped updating says so here exactly as it does on the full chart. See Data status.
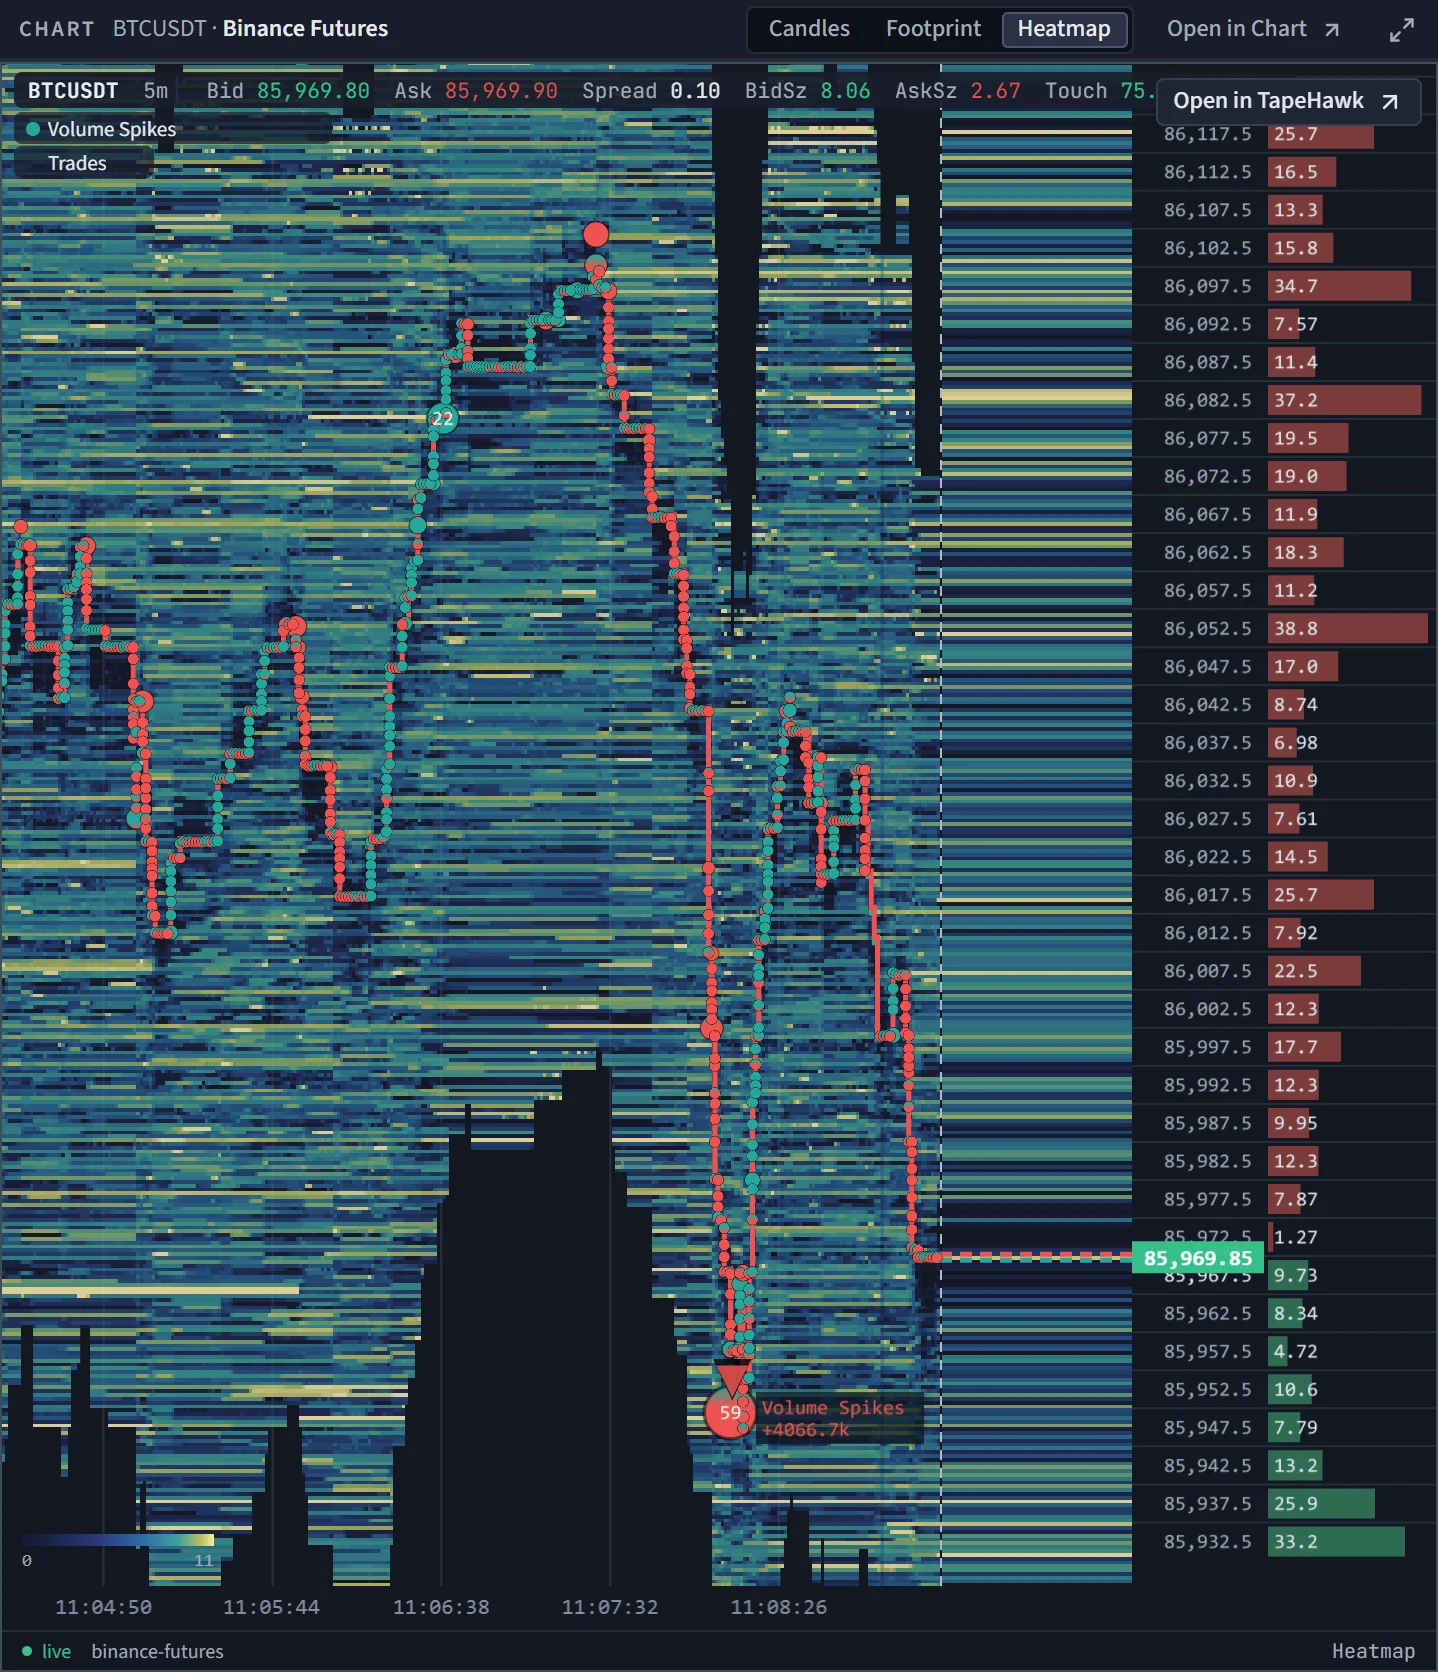
Chart type
The title bar names the market and its venue, then offers three types:
| Type | Draws |
|---|---|
| Candles | Price candles. See Series types |
| Footprint | Each bar split by price level into volume at the bid and at the ask. See Footprint |
| Heatmap | The order book over time, with trades on top. See Heatmap |
The choice is for this module only; it starts on candles each time you open the Terminal.
Anything else — another timeframe or range, indicators, drawing, a second panel — is done on the full chart.
Open in Chart
Open in Chart in the module's title bar, and the same button in the toolbar, leave the Terminal for /chart on the same symbol and venue. The title-bar button also carries the chart type you picked; the toolbar one carries only the market.
Switching markets quickly
Each new market loads a whole chart: its history, its indicators and a live connection. To keep that from spending your request allowance, the module waits for you to stop clicking before it loads the next market, and never starts one sooner than two seconds after the previous. While it loads, a loading note covers the panel. Clicking down the price table therefore shows the chart of the market you stopped on, not every market you passed.
Markets and watchlist
The price table, the watchlist of starred markets, and the toolbar's symbol search — how to find a market, how fresh its price is, and what a missing price means.
Feed
Your alerts, the signals fired across every market, and new market recaps on one timeline — how it is ordered, how to filter it, and what it says when the signal engine is down.