What is a liquidity heatmap?
A liquidity heatmap draws the order book over time: price up the side, time across, each cell coloured by how much size was resting there.
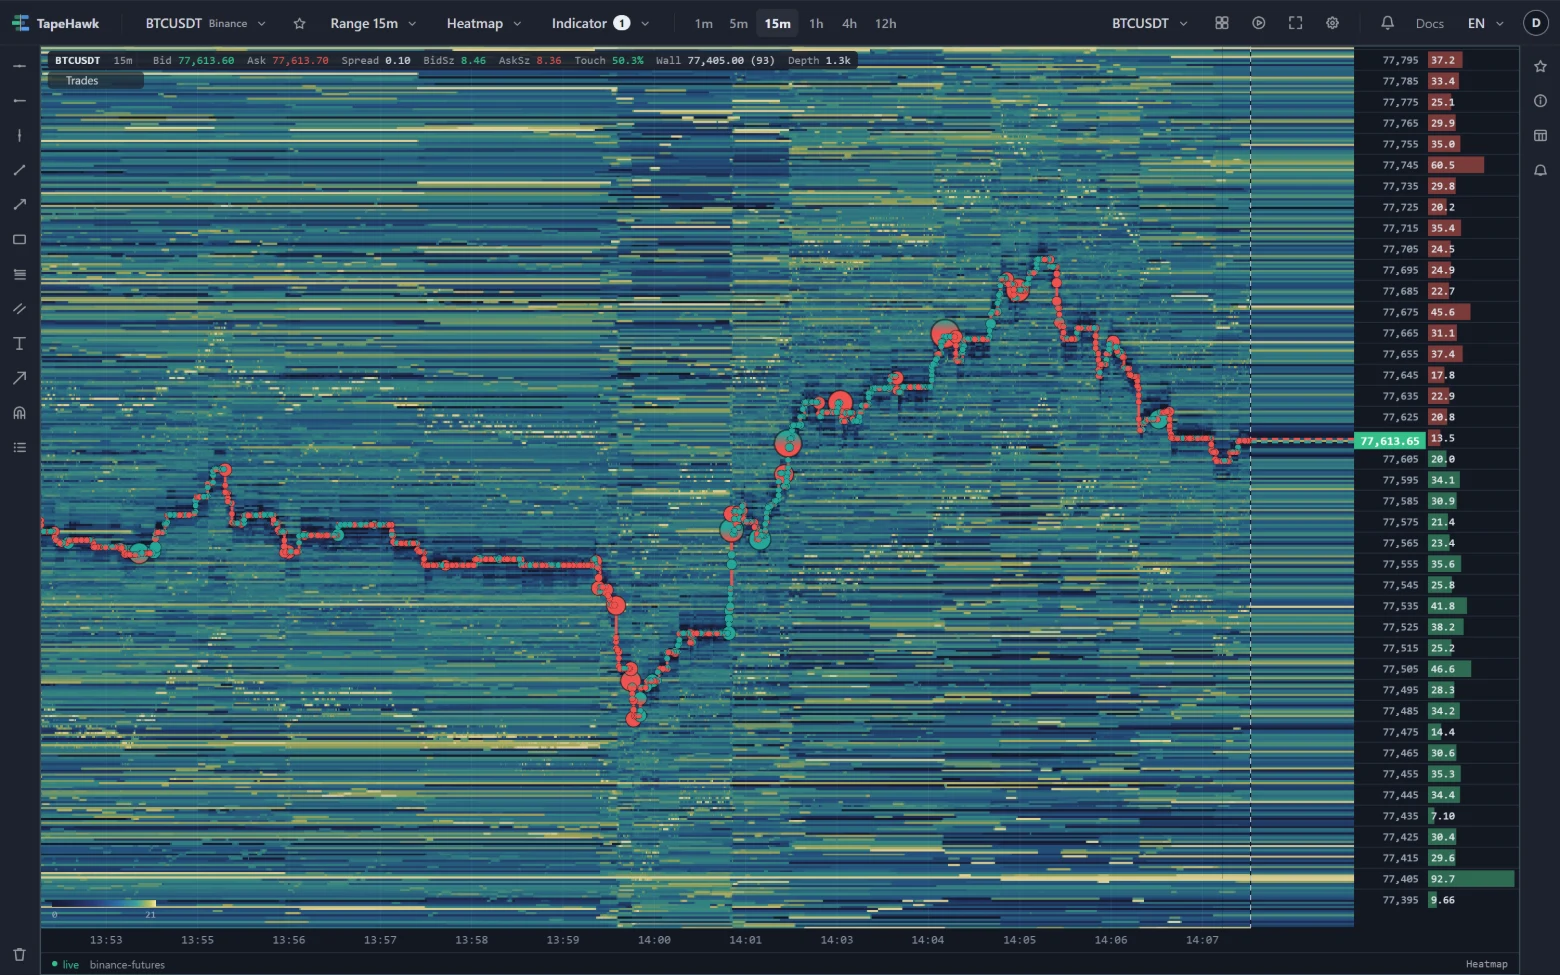
The order book at any instant is a list: so much size resting to buy at each price below the market, so much to sell at each price above. A liquidity heatmap records that list continuously and draws it as a picture. Price runs up the side, time runs across, and every cell is coloured by how much size was resting at that price at that moment. A candle shows where price went; a heatmap shows what was waiting for it there.
What it looks like on the chart
In the fifteen-minute heatmap above, the long horizontal streaks are resting orders that stayed in the book; the brighter the streak, the larger the size. The two stair-steps through the middle are the best bid and best ask, and the circles on them are executed trades. On the right, past the dashed line, the book as it stands right now continues into the price ladder, where the Size column prints the resting quantity at each price — 92.7 at 77,405, the brightest band at the bottom of the panel.
How traders read it
- Walls. A bright band that persists is a large order that stayed. Price often slows as it approaches one.
- Held or pulled. When price reaches a band, either trades print into it and it thins (the size was real and got filled), or the band disappears before being hit (the order was pulled).
- Thin areas. Dark stretches have little resting size. Price can move through them quickly, because there is little to trade against.
- Shifts. Size appearing or vanishing as price moves shows participants changing their minds in real time.
A heatmap shows displayed intent, and displayed intent can change. It is strongest read together with the trades that actually printed.
On TapeHawk
Pick Heatmap in the chart-type menu. It records the book continuously for recorded symbols, so you can scroll back through history, change the range from minutes to hours, and add trade bubbles, volume profiles and order-flow marks on top.