What is the DOM (depth of market)?
The DOM, or depth of market, is the live list of resting buy and sell orders at each price around the current price.
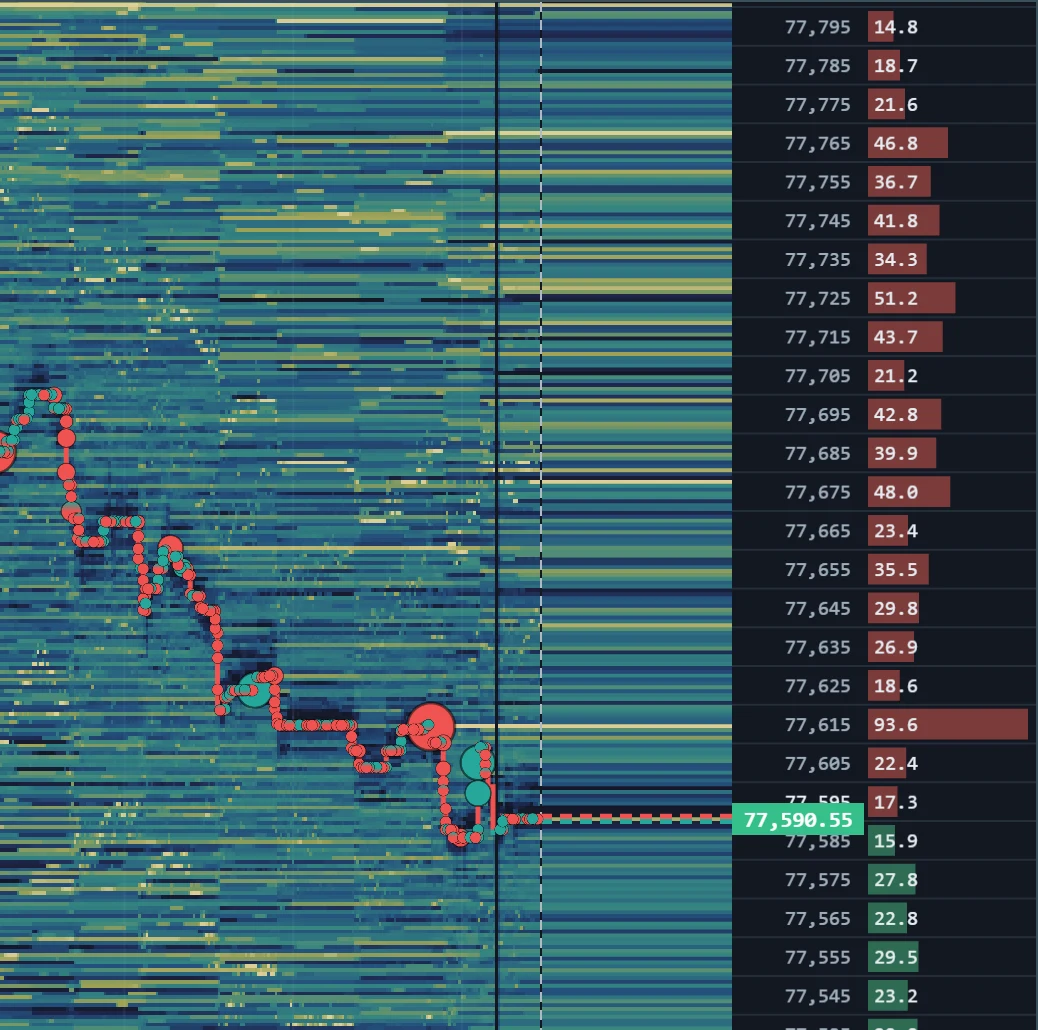
DOM stands for depth of market. It is the live view of the order book: for each price around the current one, how much size is resting to buy below and to sell above. The best bid and best ask sit at the centre; the further a row is from them, the deeper into the book it is. Traders sometimes call the vertical DOM display a price ladder.
What it looks like on the chart
On the right edge of the heatmap above, TapeHawk turns the price axis into a ladder. Each row is a price, with a bar and a figure for the size resting there: the red rows above the current price are offers, the green rows below are bids. One row stands out — 93.6 resting at 77,615, far more than its neighbours. To the left of the ladder, past the pale vertical line, the live-book band paints the same book in the heatmap's colours, so a level that has been resting for a while runs out of the history as one unbroken band.
How traders read it
- Where size sits. Large resting orders near the market are the obvious places where price may slow down or where aggressive orders will be absorbed.
- How it changes. A DOM is a snapshot that updates many times a second. Size added as price approaches, or pulled just before it arrives, says more than the size itself.
- Balance around the touch. More size on one side of the best bid and ask shows where it will take more aggression to move price.
A DOM shows only what is displayed. Iceberg orders refill without showing their full size, and displayed orders can be cancelled at any moment. That is why many traders read the DOM next to a heatmap, which keeps the history the ladder forgets.
On TapeHawk
The ladder appears on any heatmap panel at least 640 pixels wide. The info bar above the chart adds the book read-outs — best bid and ask sizes, the largest nearby wall and total depth.