What is order flow trading?
Order flow is the stream of executed trades and resting orders behind every price move, read to see who is pushing the market and where.
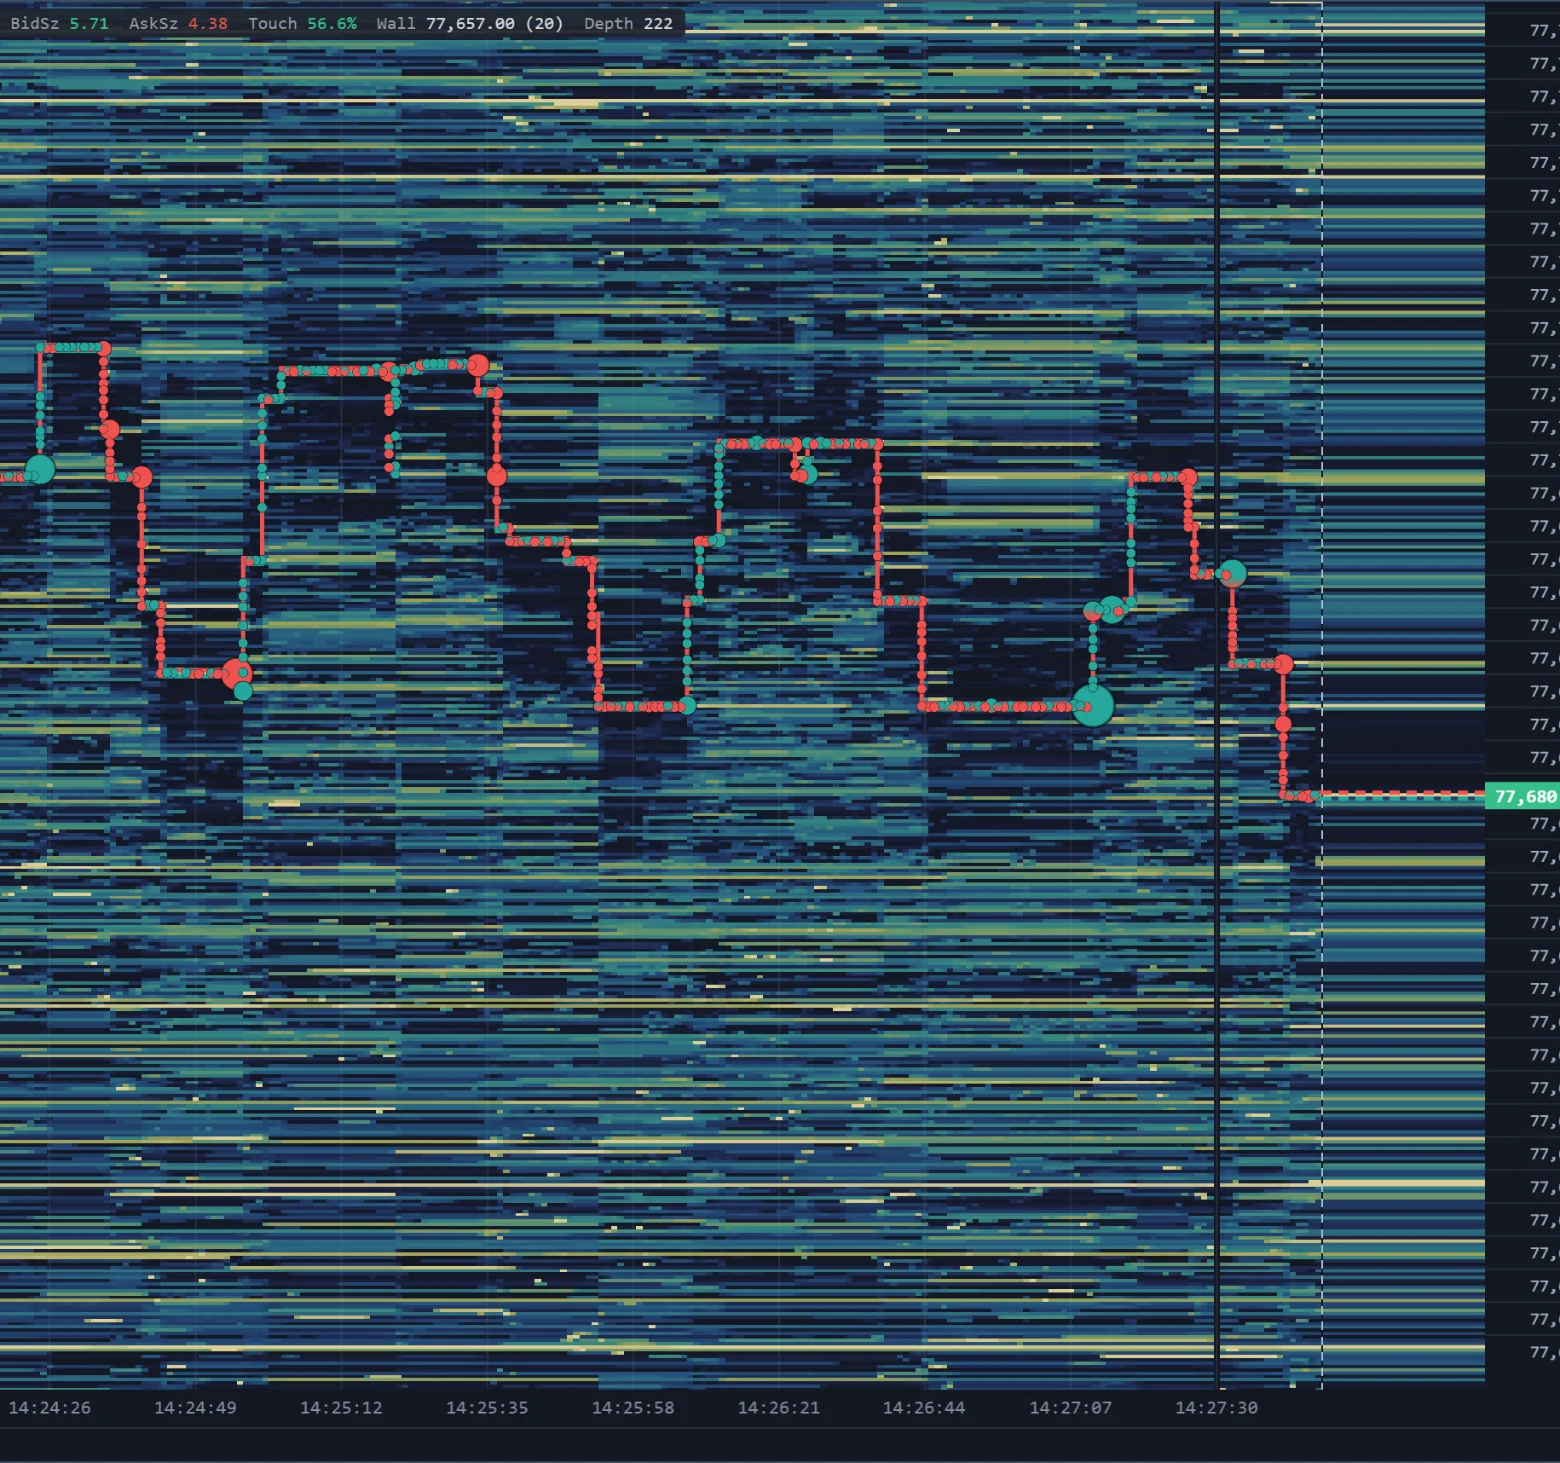
Price moves because orders meet. Order flow is the study of those orders: the trades that executed — who was the aggressor, how large, at what price — and the limit orders waiting in the book that those trades ran into. Where a candle chart summarises a minute into four prices, order flow looks at the individual prints and the liquidity around them.
What it looks like on the chart
The heatmap above puts both halves on one screen. The coloured field is the order book over time — the brighter a row, the more size was resting at that price. The circles are executed trades at the price and time they happened, sized by volume, green where buyers were the aggressor and red where sellers were. The two stair-steps trace the best bid and best ask. You can watch price step down into a band of resting bids, see which trades printed there, and whether the band held or was pulled.
How traders read it
- Aggression against liquidity. Large aggressive trades that do not move price are running into resting size; small trades that move price easily are moving through thin liquidity.
- Intent in the book. Resting orders can be pulled before they are hit. Watching whether size stays when price arrives separates liquidity that was real from liquidity that was only displayed.
- Context for price levels. A level where heavy trading happened, where a large order rested, or where one side was absorbed tells you more than a line drawn at a previous high.
Order flow does not predict. It shows what participants did and are showing they will do — and leaves the reading to you.
On TapeHawk
TapeHawk is built around order flow: the liquidity heatmap with trade bubbles, the footprint chart, delta and CVD, and marks for absorption, sweeps and large trades — all computed from the exchange's own trades and book on Binance Futures and Bybit.