What is delta in order flow?
Delta is aggressive buying volume minus aggressive selling volume, over a bar, a price level or a stretch of time.
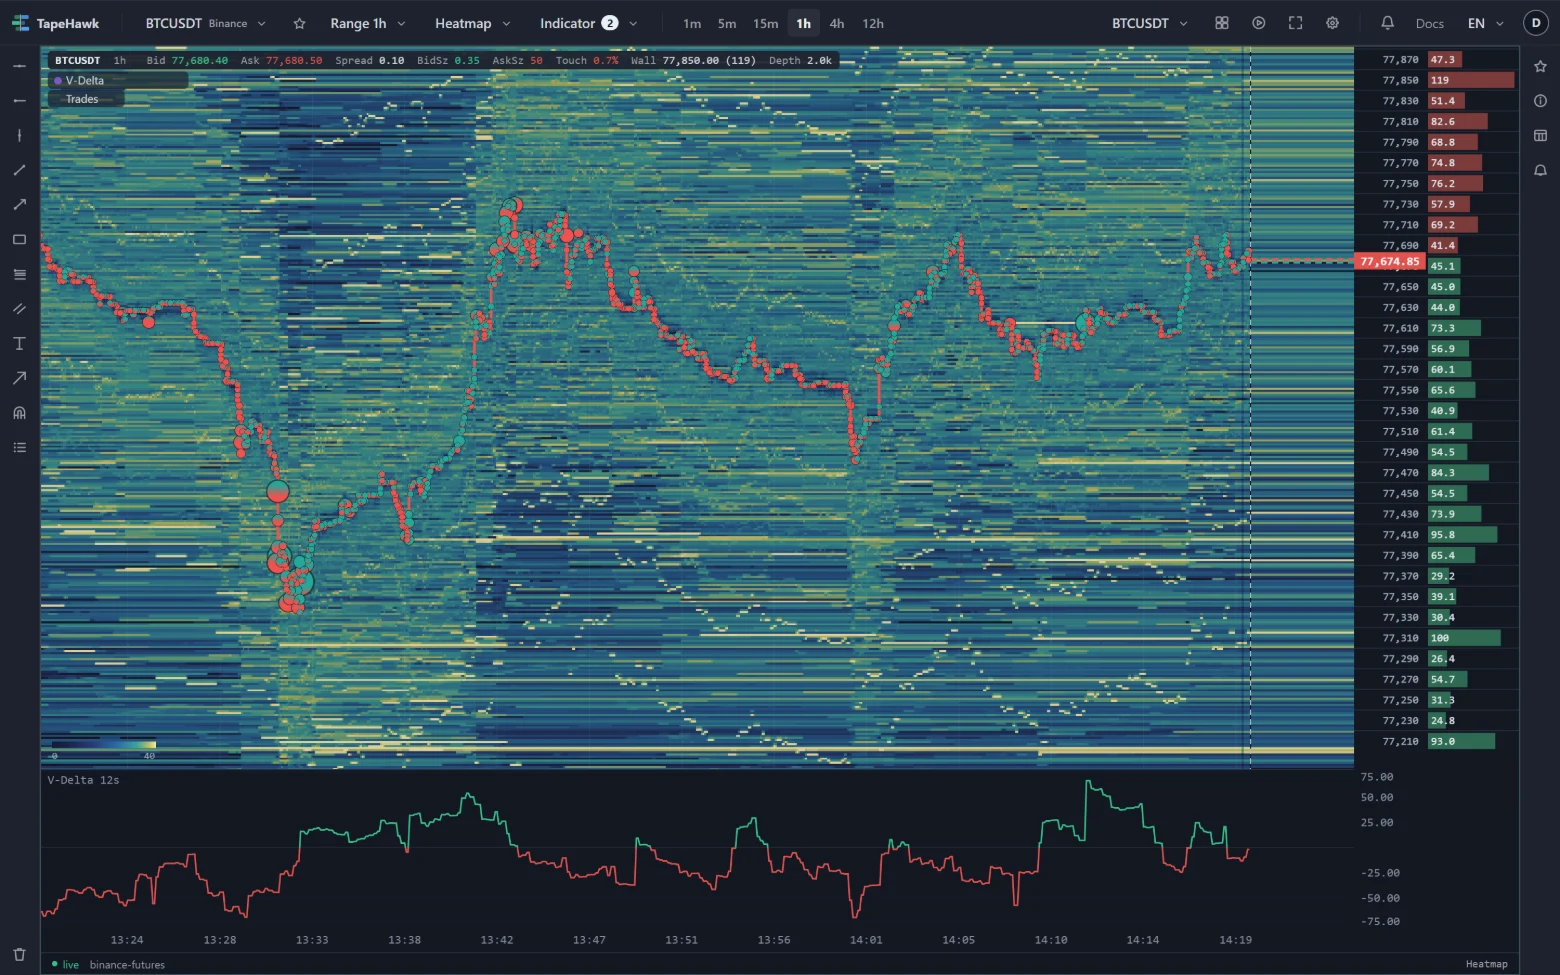
Every trade has two sides, but only one of them chose to cross the spread. When a buyer lifts the offer, the trade counts as aggressive buying; when a seller hits the bid, aggressive selling. Delta is the first minus the second over whatever you are measuring: one bar, one price row inside a bar, or a stretch of time. Positive delta means aggressive buyers traded more; negative, aggressive sellers.
What it looks like on the chart
The band under the heatmap above draws a short-memory delta: a line that swings above zero in the up colour when aggressive buying dominates and below zero in the down colour when selling does. Each trade counts in full when it prints and then fades out, so the line shows who is pressing now — the surge near the right edge, past 70, is a burst of buying that the earlier swings do not come close to. On a footprint chart the same idea is printed per bar as D: and per price in the cells.
How traders read it
- Agreement. Price rising on positive delta says aggressive buyers are driving the move; falling on negative delta, sellers.
- Disagreement. Price rising while delta is negative says the move is not coming from aggressive buying — often sellers withdrawing their offers. It can be sturdy or fragile, and the book shows which.
- Surges and fades. A sharp swing in delta marks a burst of one-sided aggression. Delta sinking back towards zero while price keeps going says the push behind the move is weakening.
Delta counts aggression, not intent. A large negative delta can be sellers exiting, not new shorts, and the number alone cannot tell the two apart.
On TapeHawk
Delta appears in the footprint (per bar and per cell), as V-Delta under a heatmap, and summed over time as CVD. All of them are computed from the individual trades, not estimated from candles.