What is CVD (cumulative volume delta)?
CVD is the running total of delta: aggressive buying minus aggressive selling, added up trade by trade over time.
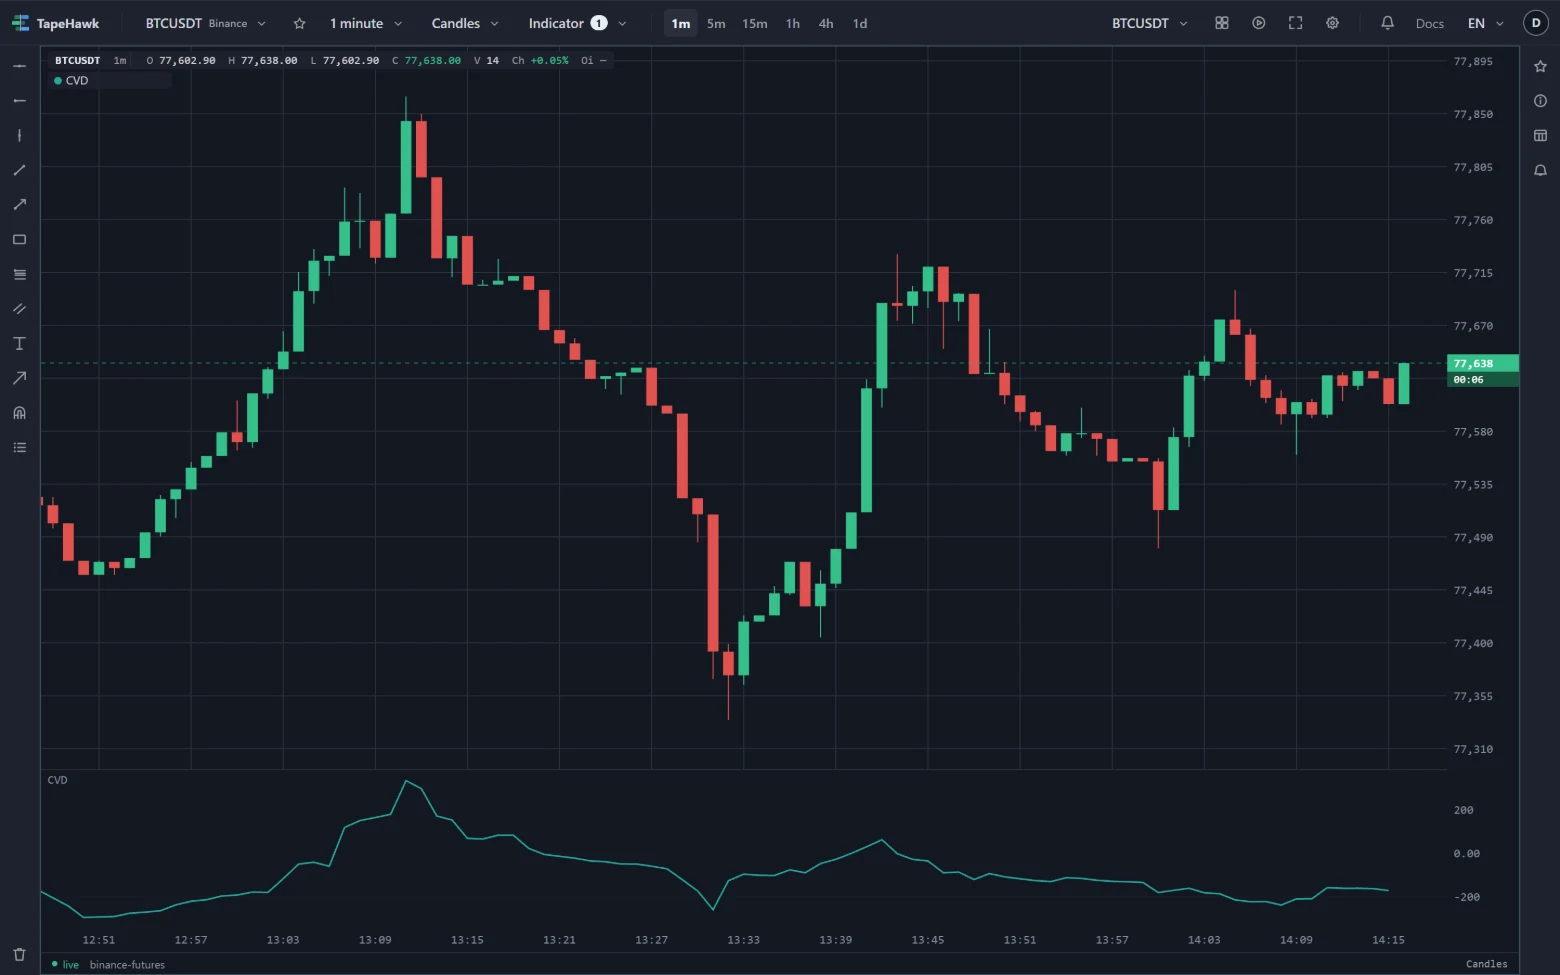
Delta is aggressive buying minus aggressive selling. CVD, cumulative volume delta, keeps a running total of it: every trade adds its size if the buyer was the aggressor and subtracts it if the seller was. The line that results rises while aggressive buyers dominate and falls while aggressive sellers do, and its slope says how hard they are pressing.
What it looks like on the chart
The band under the one-minute candles above draws CVD as a line. From 12:51 it climbs with price into the 13:09 high, then drops with the sell-off to 13:33. Look at the second rally, from 13:39 to 13:45: price recovers most of the way, but CVD rises only a fraction of what it did the first time. The second advance was made on far less aggressive buying.
How traders read it
- Agreement. CVD rising with price says aggressive buyers are driving the move; falling with price, aggressive sellers.
- Divergence. Price making a new high while CVD makes a lower one says the high was reached on less aggressive buying than the last — often passive sellers absorbing the buying, or buyers simply stepping back. The reverse at lows. Divergence describes a change in who is pushing; it does not say when price will react.
- Pressure without movement. CVD climbing while price stays flat means buyers keep lifting offers that keep being refilled. Something is absorbing them.
CVD has no fixed zero: its level depends on where the count started. Read its direction and slope, and compare swings on the same chart.
On TapeHawk
The CVD indicator draws the running total, or each bar's own delta as columns, in a band under a candles, footprint or heatmap panel. It is computed from the individual trades, so a green candle can still carry negative delta — and CVD will show it.