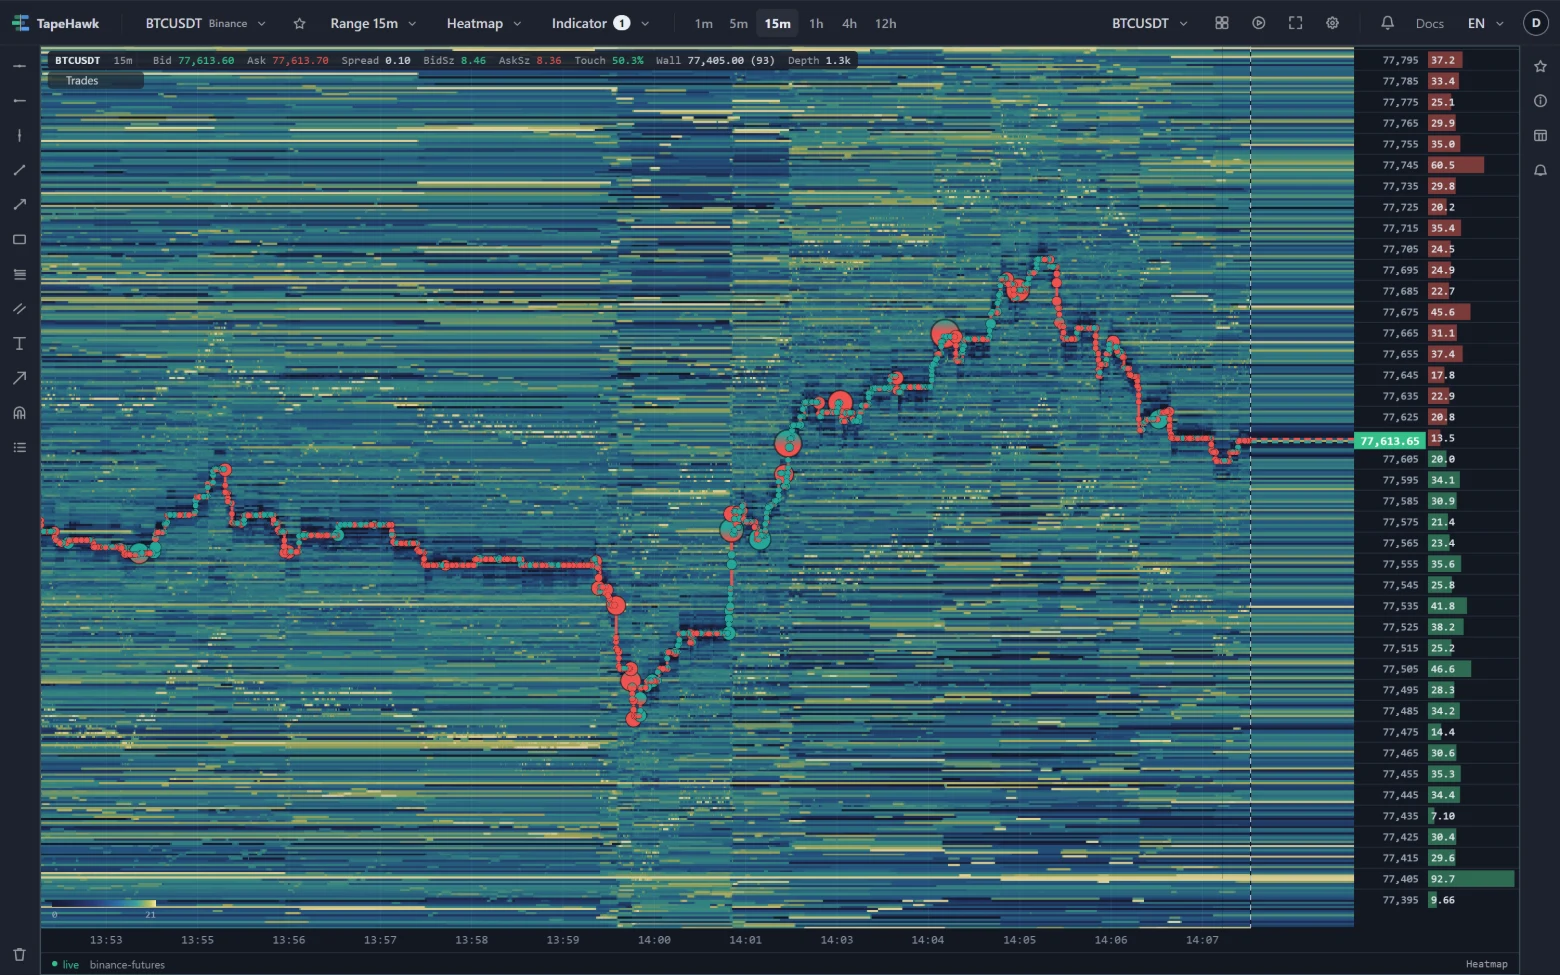
Liquidity heatmap
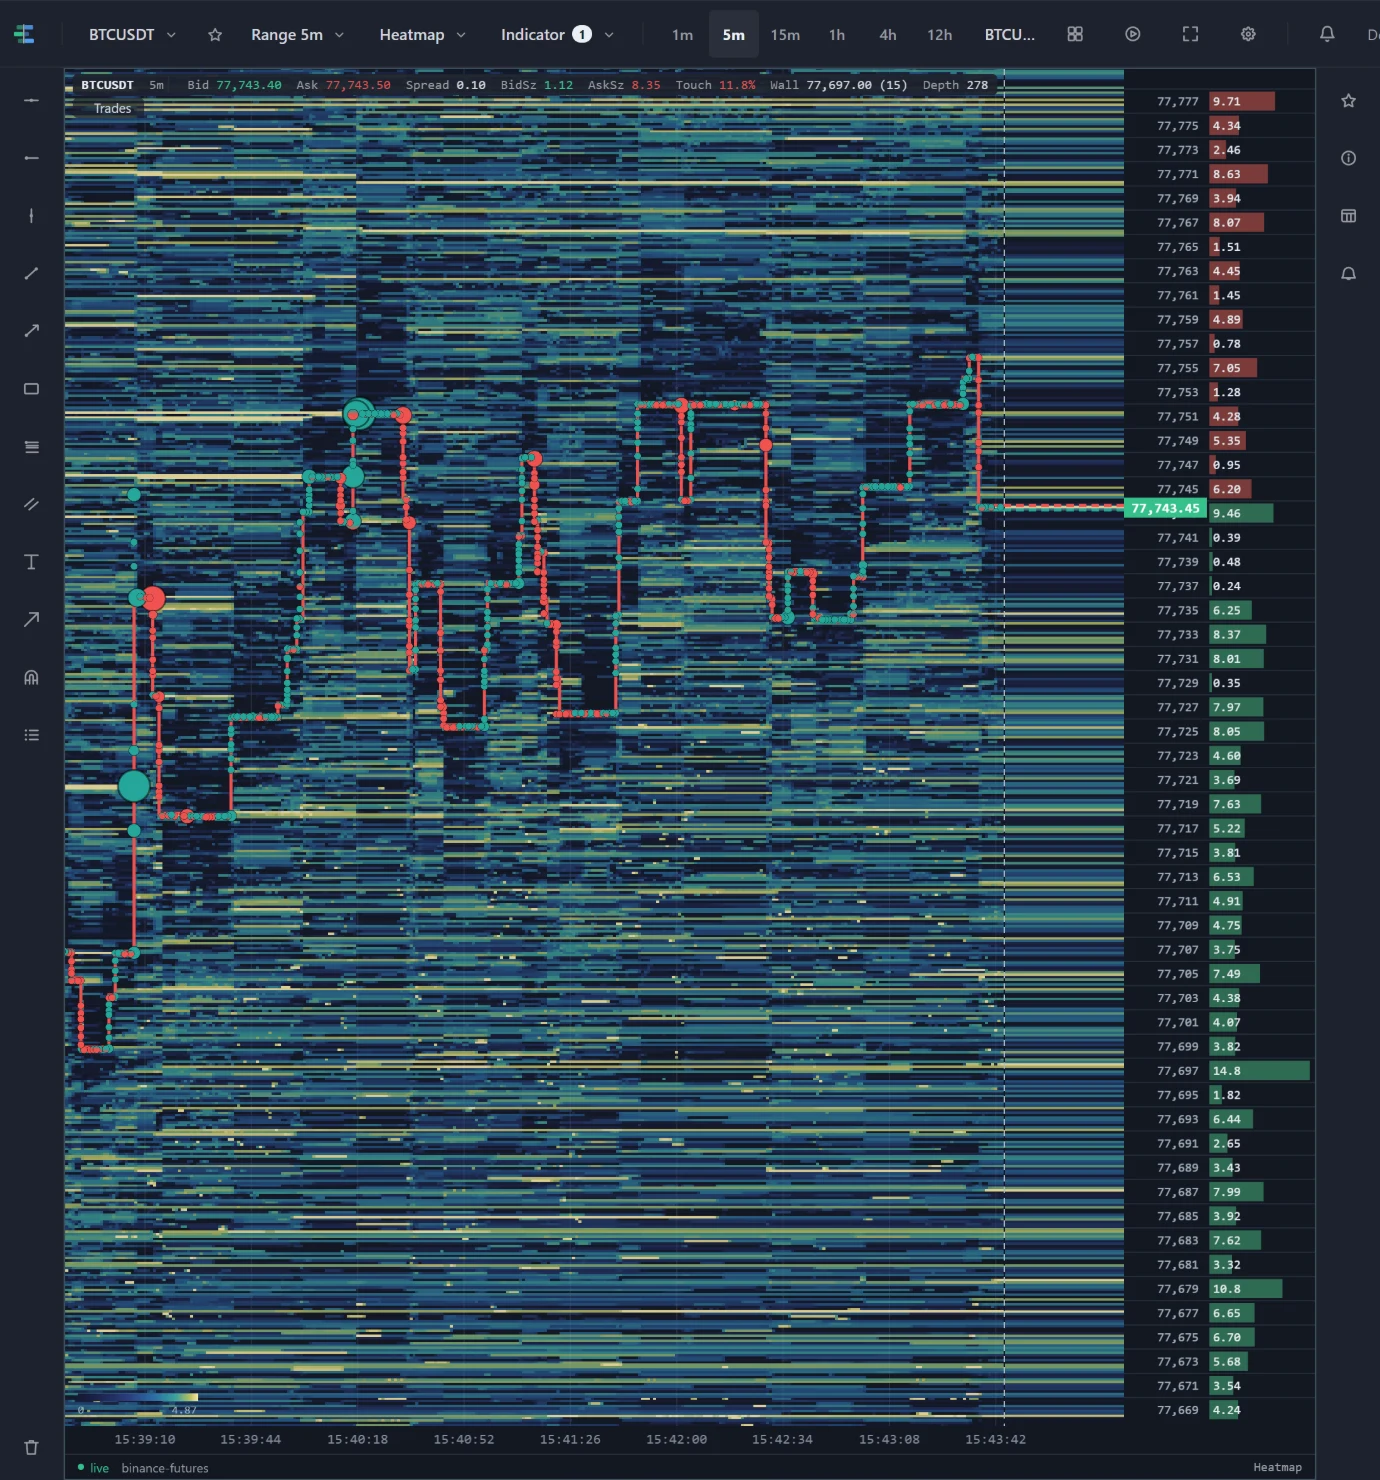
The whole order book over time, smoothed on the GPU. You see the wall before price reaches it.
Liquidity heatmap, footprint and CVD on Binance Futures and Bybit, updated in under a second.
Those four numbers drop the part that matters: where the resting volume sits, who pulled their orders just before price arrived, and which print ate a whole level.
The heatmap redraws the entire order book over time. Bright bands are liquidity waiting; dark gaps are where it just went.
One data stream, not six separate tools bolted together.
The whole order book over time, smoothed on the GPU. You see the wall before price reaches it.
Buy and sell volume split per price level, with imbalances marked.
Server-anchored cumulative delta, with live liquidation bubbles.
Write an indicator in a single file. The browser compiles it to WASM and runs it.
@indicator sma
@kinds candles, footprint
@render overlay

input len = 50, min 1, max 1000
input color = color "#42a5f5"

plot line = sma(close, len), color color
One .ind file, compiled to WASM, running on the chart
Set a rule on the indicator itself. It fires when the mark appears on the chart.
Play a historical window back at its real pace to practise reading order flow.
Seven more things the chart does, photographed from the running app. Each one opens its page in the docs.
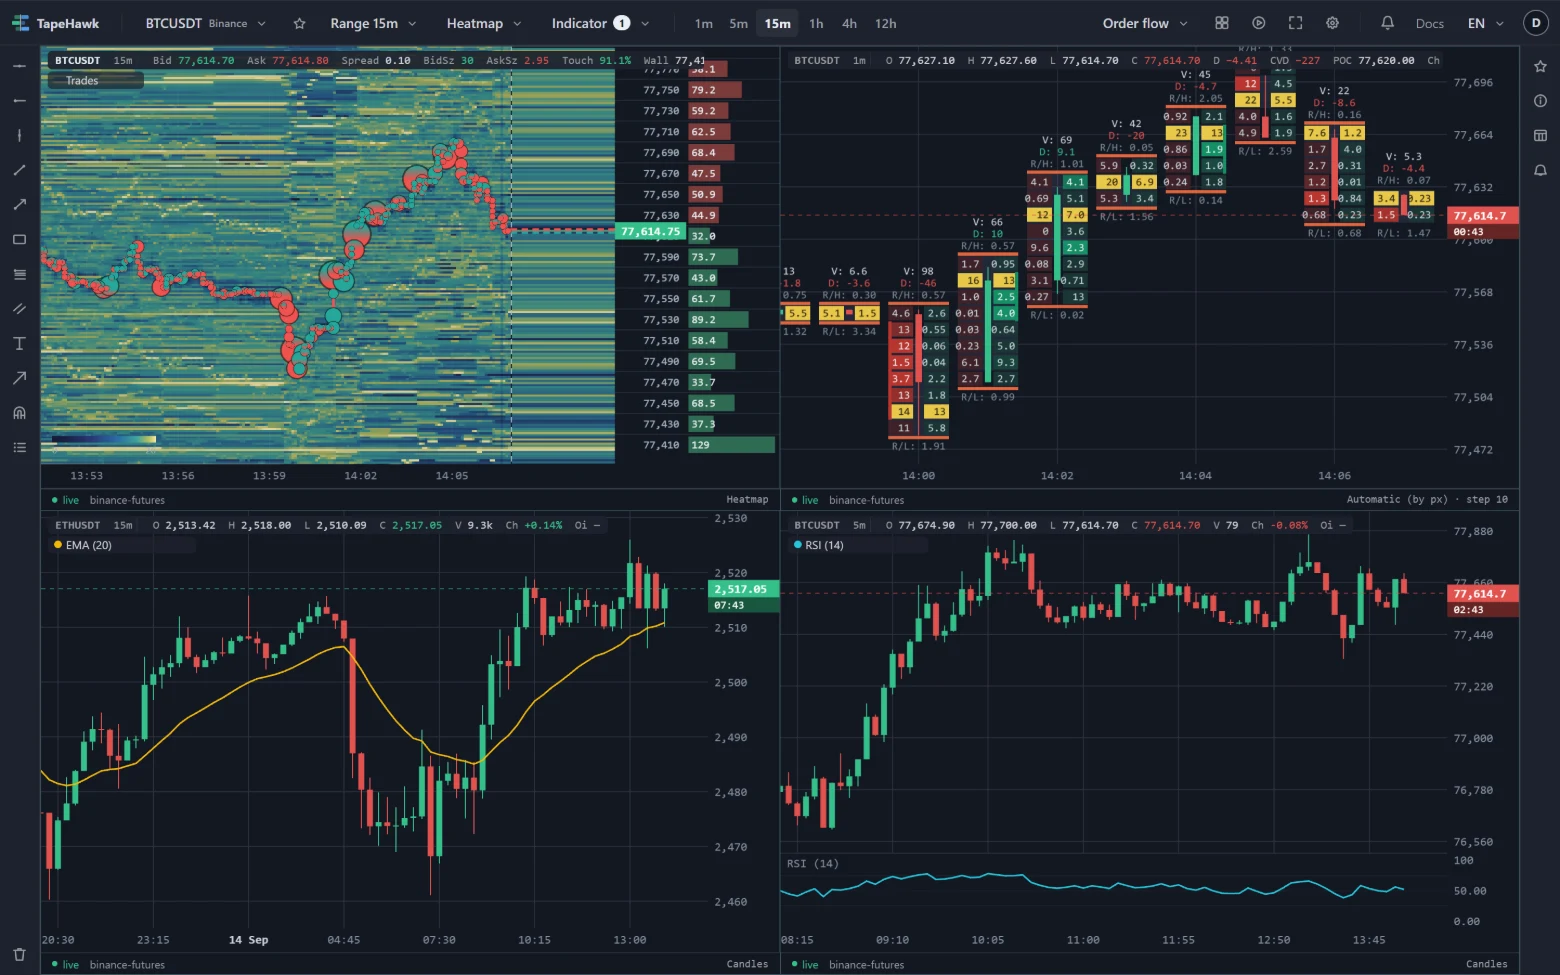 Four panels, one screenA heatmap, a footprint and two candle panels side by side, each with its own symbol and timeframe.
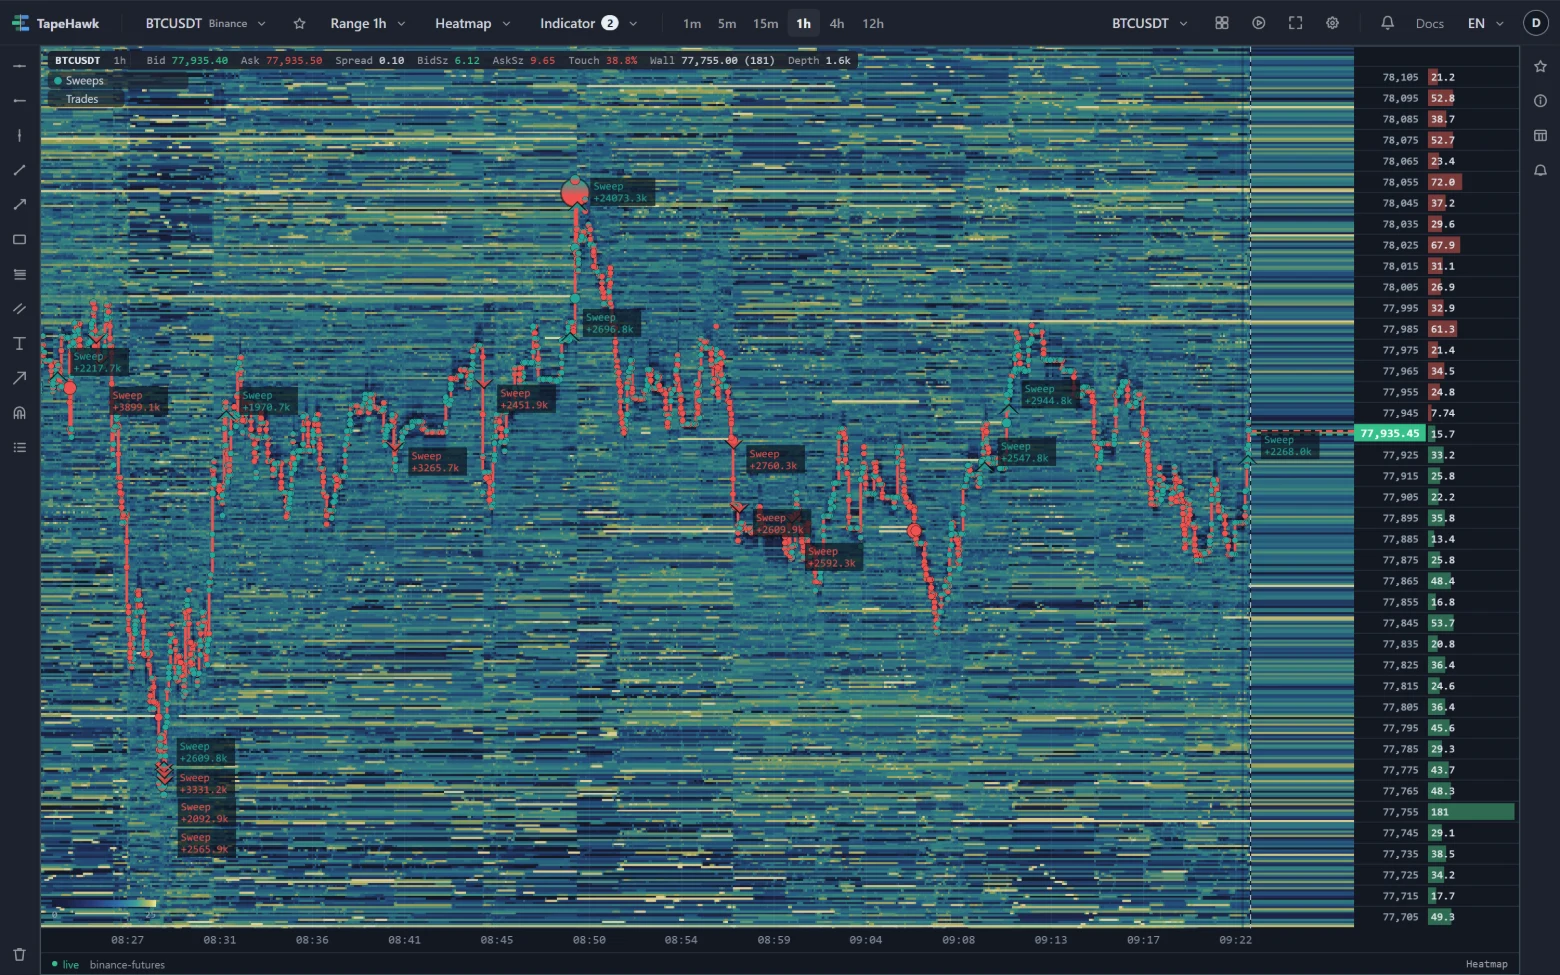 Order-flow events, labelledSweeps, stop runs, absorptions and big trades are marked on the heatmap at the price where they happened.
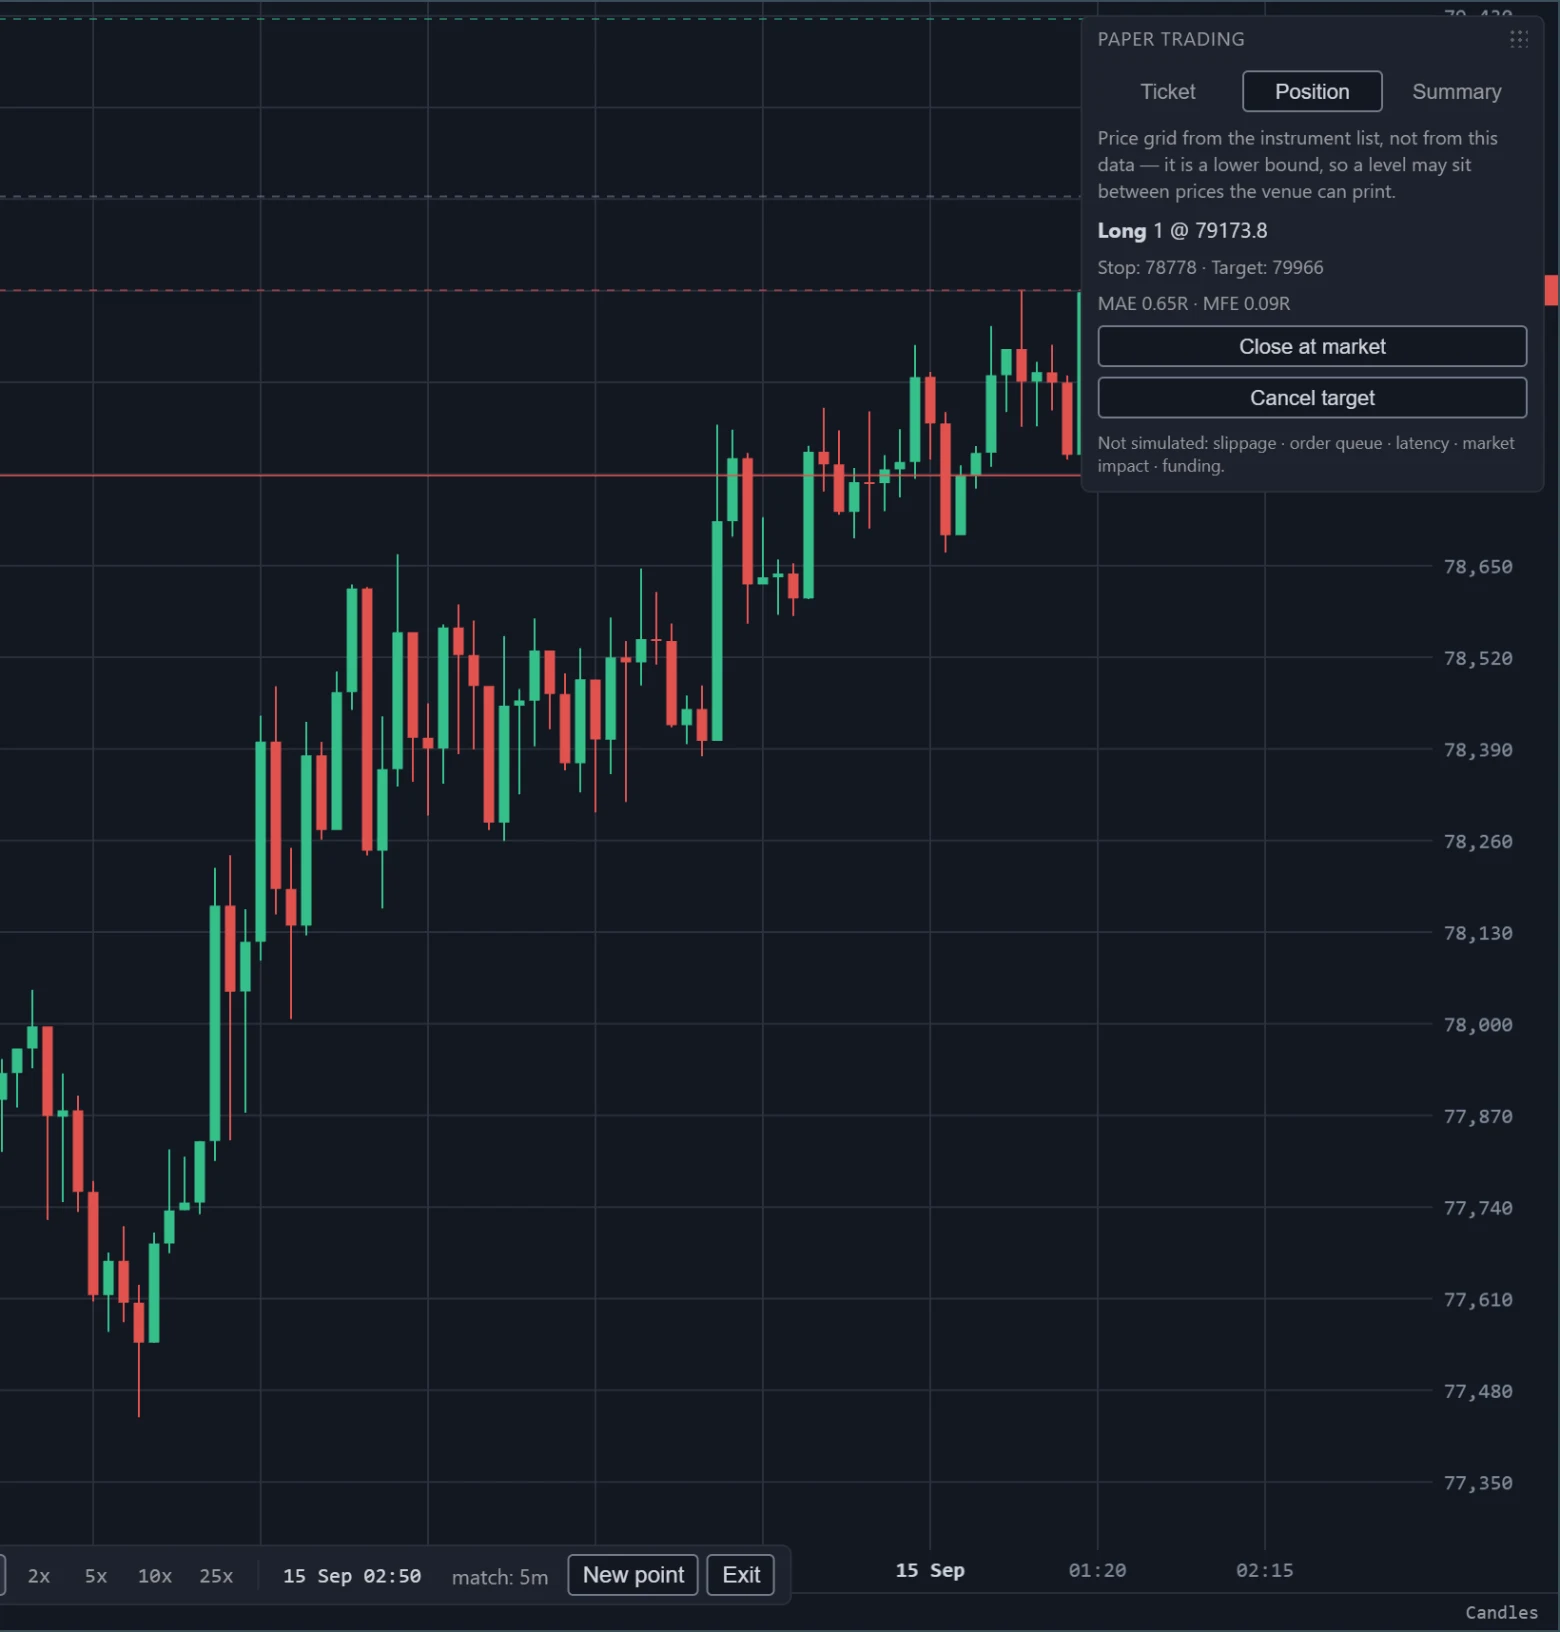 Paper trading on a replayGo back to any bar, play it forward at up to 25 bars a second, and trade it with a stop, a target and results in R.
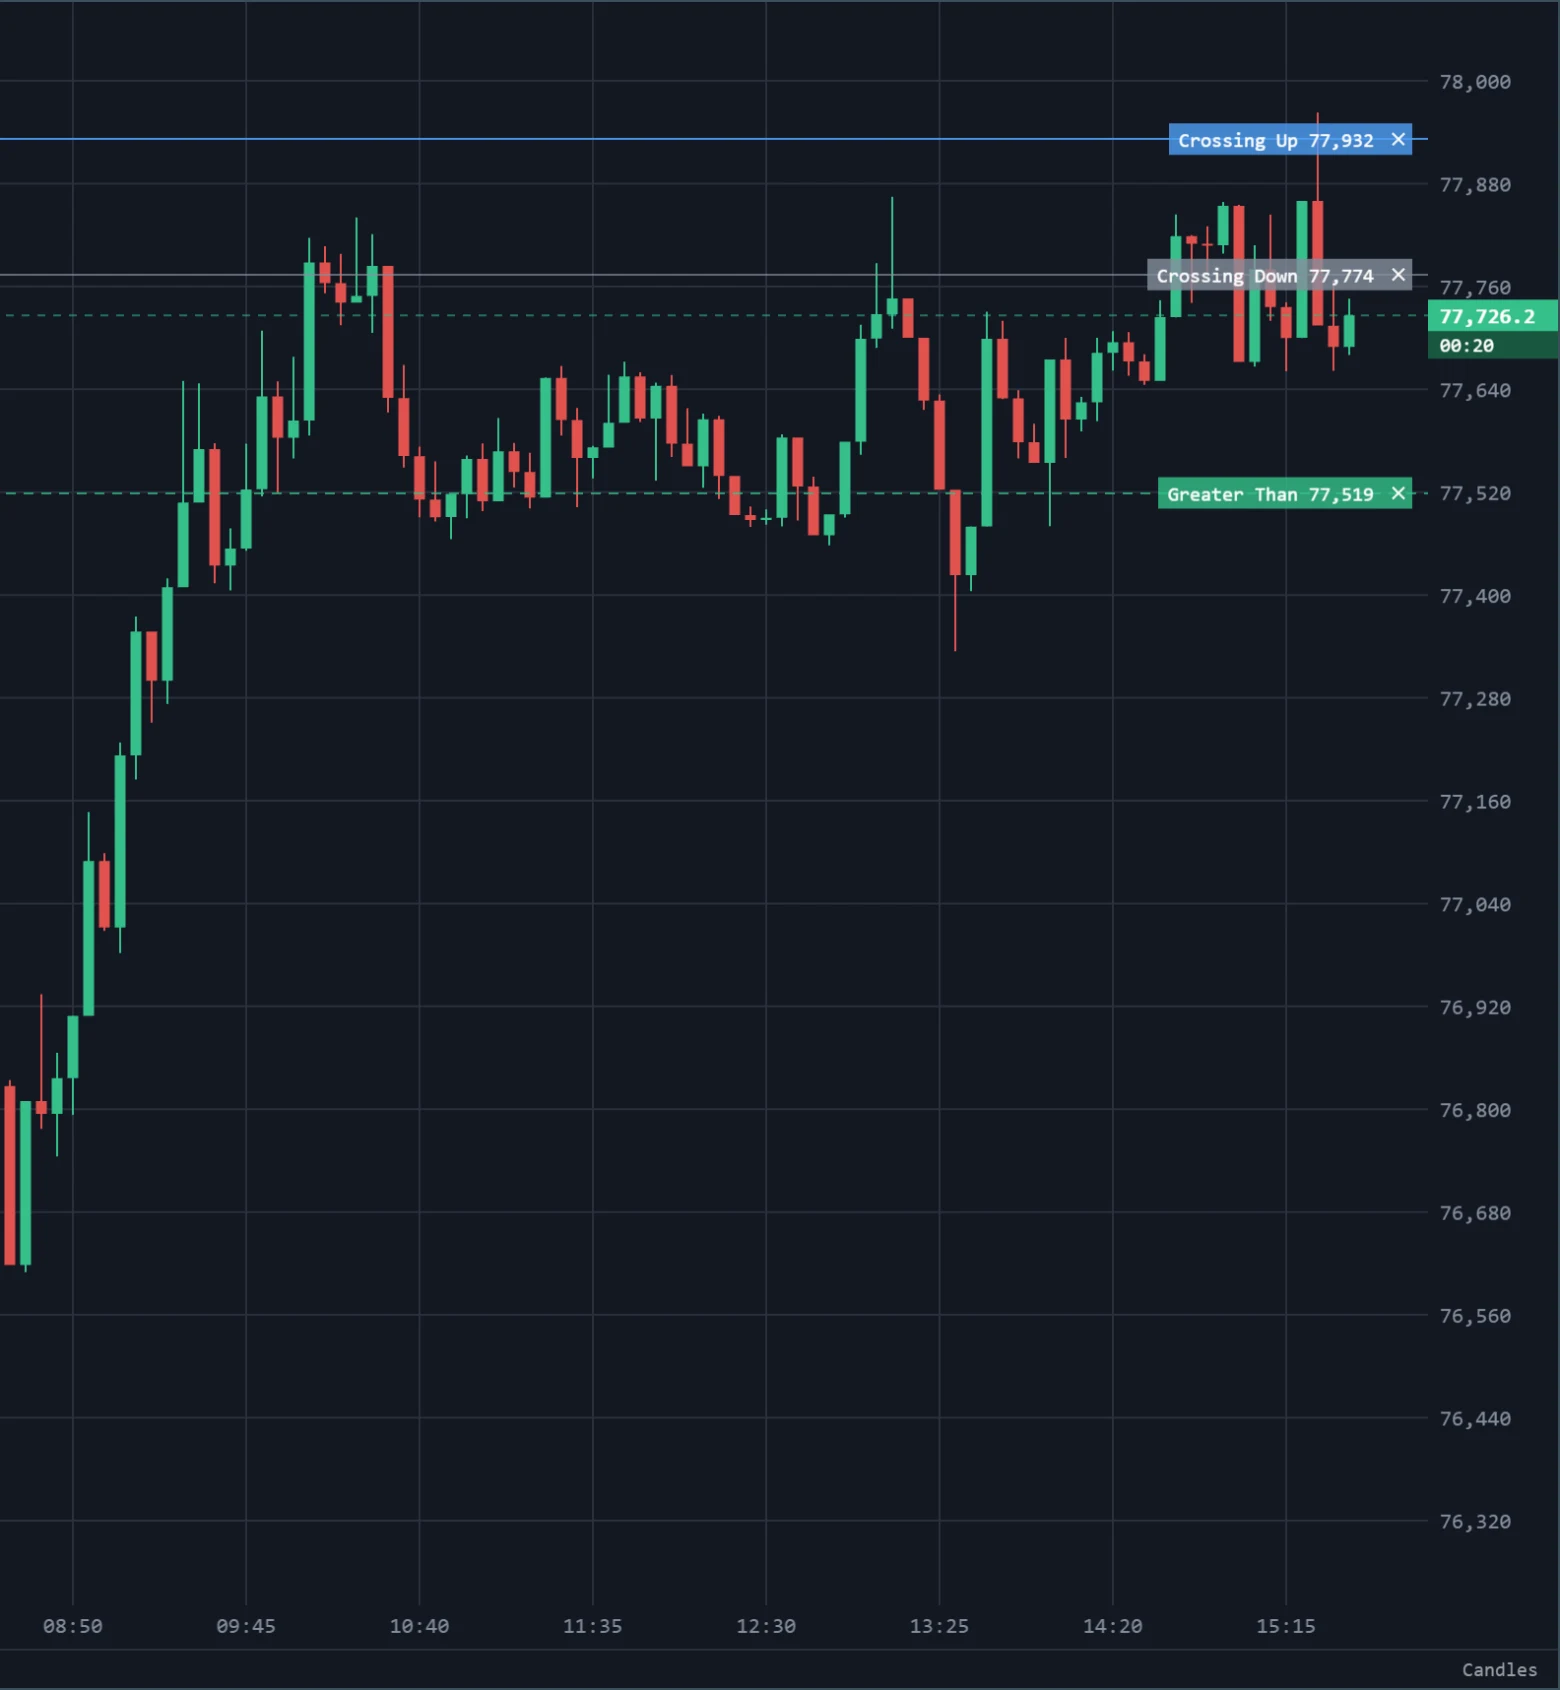 Alerts you set on the chartCrossing up, crossing down, greater than. Each alert is a labelled line at its price.
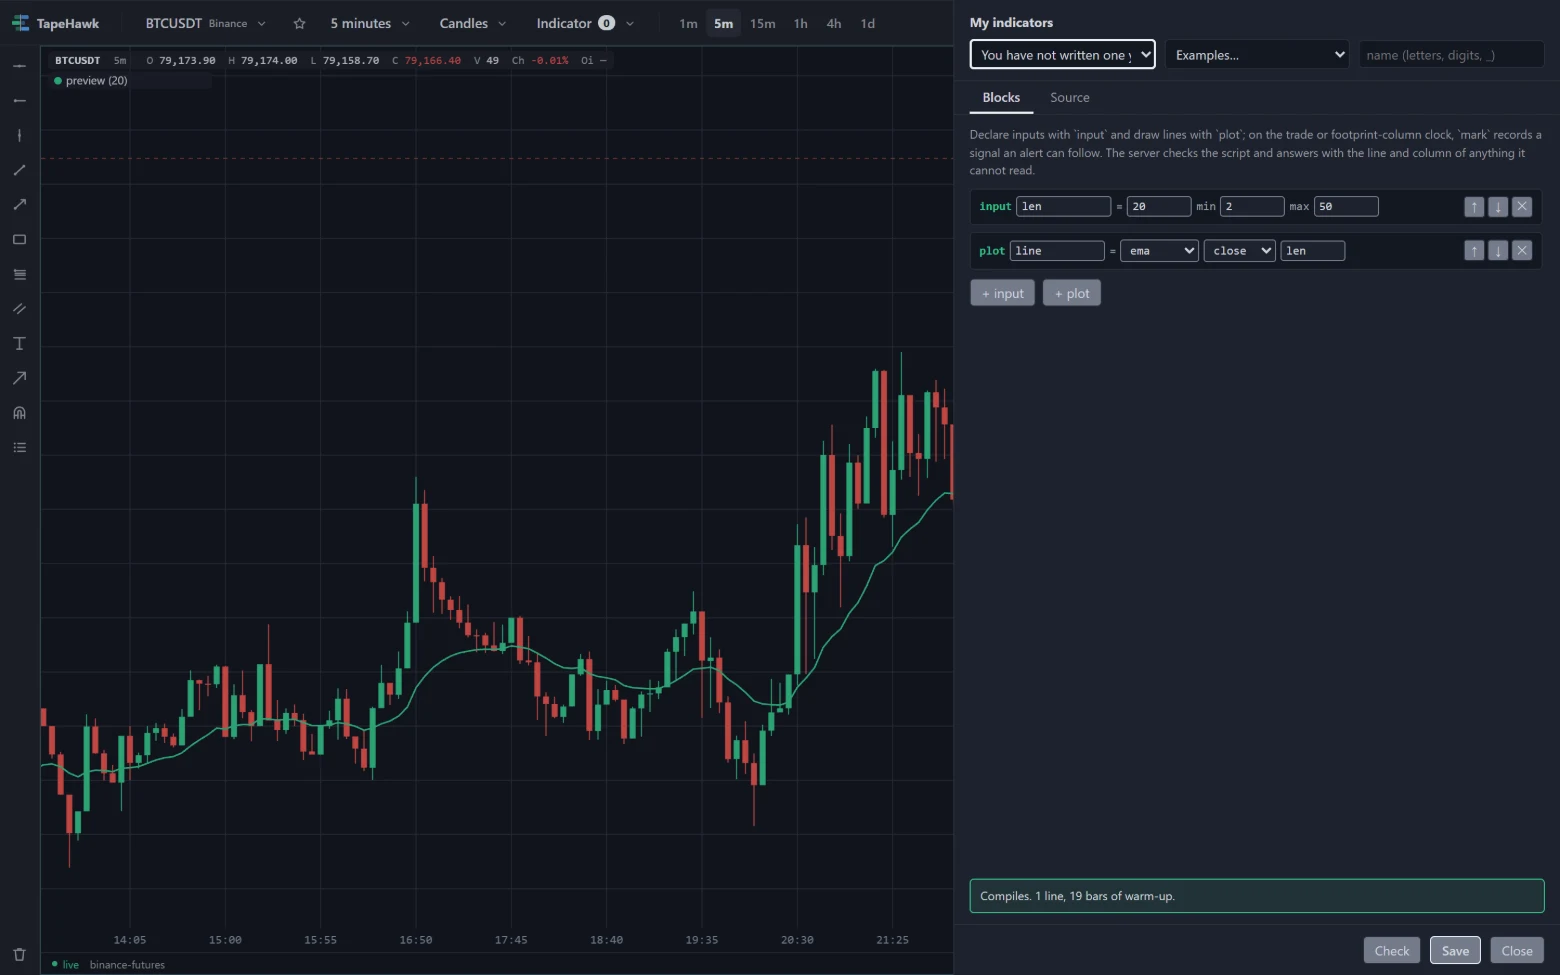 Indicators built from blocksAdd inputs and plots as blocks, or switch to the source. The editor checks the script and previews it on the chart.
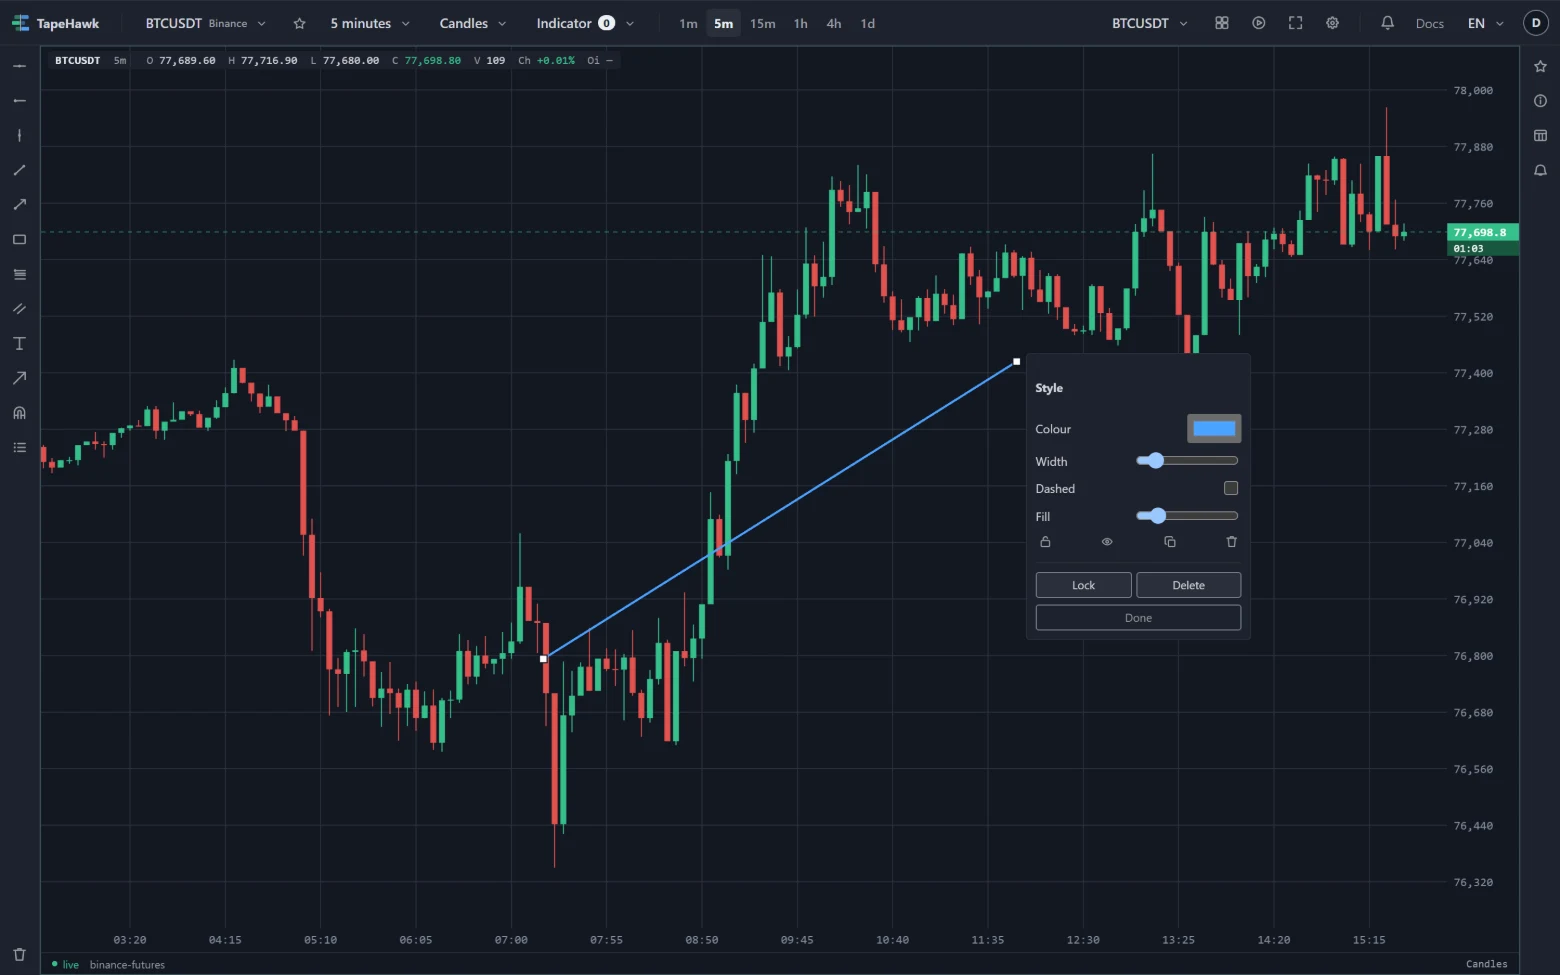 Ten drawing toolsTrend lines, rays, zones, Fibonacci, channels and notes, saved for each symbol in your account.
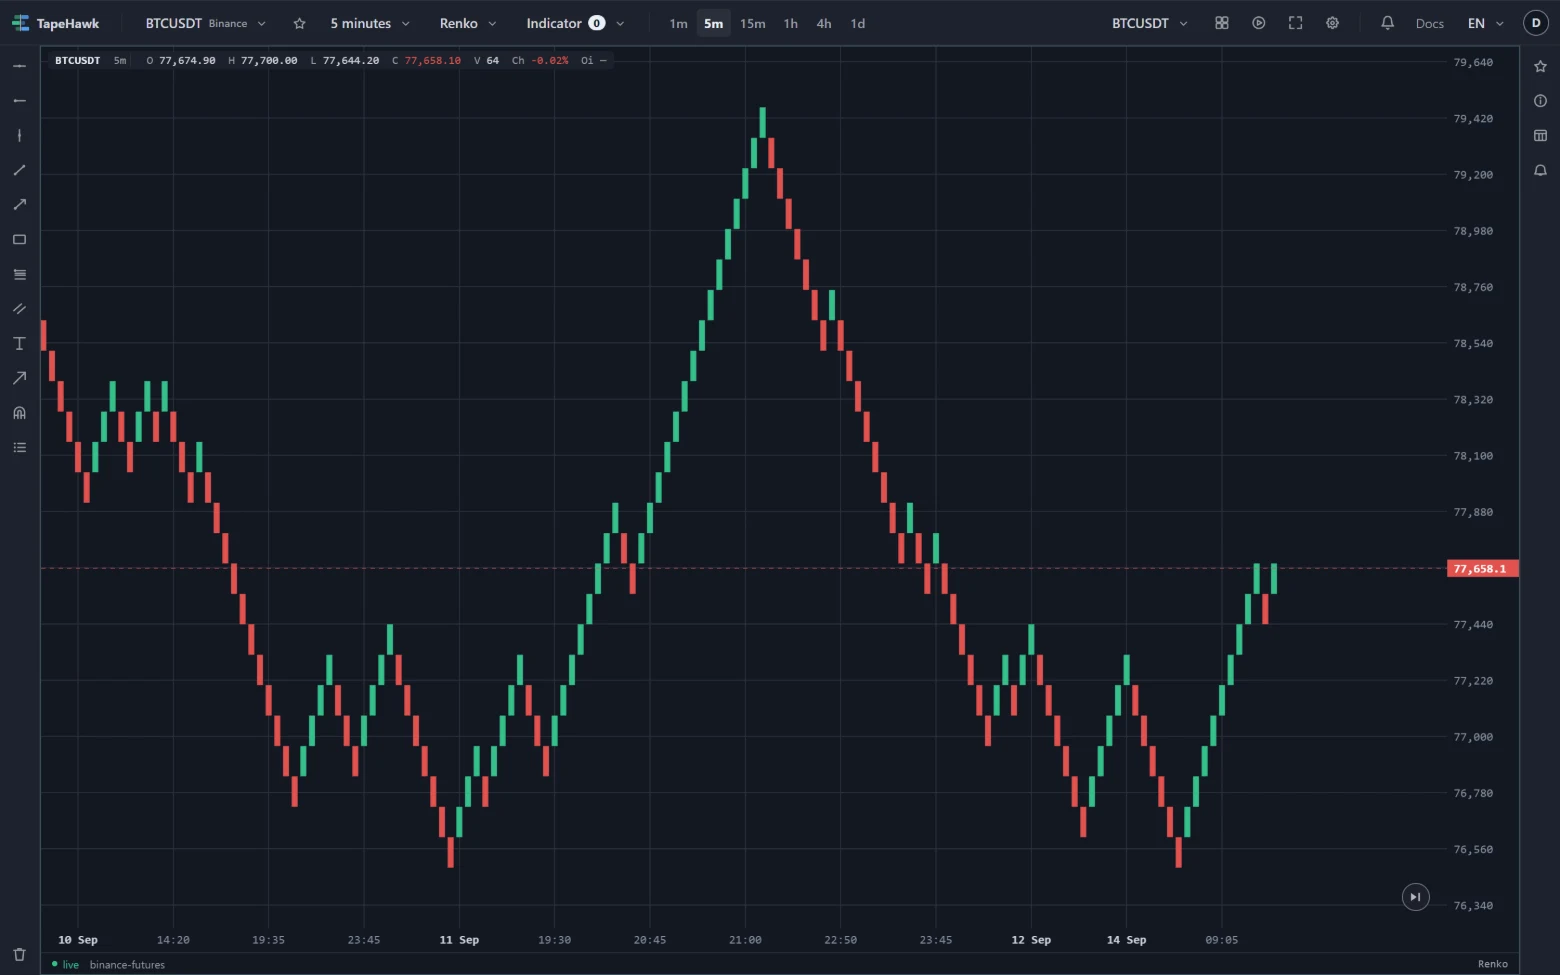 Ten candle shapesHeikin Ashi, Renko, range bars and line break, next to plain and hollow candles, bars, line, area and step.
Everything in the chart today, by group. A group name opens its docs.
The chart is open to everyone. An account keeps your work and opens the rest.
The whole chart on one panel. Nothing is saved when you leave.
Everything a visitor has, and six things more.
Free, no card. Panels, alerts and your own indicators switch on once you confirm your email.
Nothing to install, no card. The chart opens before you log in.
Pick a venue and a pair. Data arrives immediately, no account needed.
Heatmap, footprint, CVD or an indicator. Add and remove them on the panel.
Log in to save layouts and get alerts by bell or email.
No card and no trial clock. Or open the chart first, and sign up when there is something you want to keep.