What is market depth?
Market depth is how much size rests in the order book beyond the best bid and ask — the limit orders waiting at each price above and below the market.
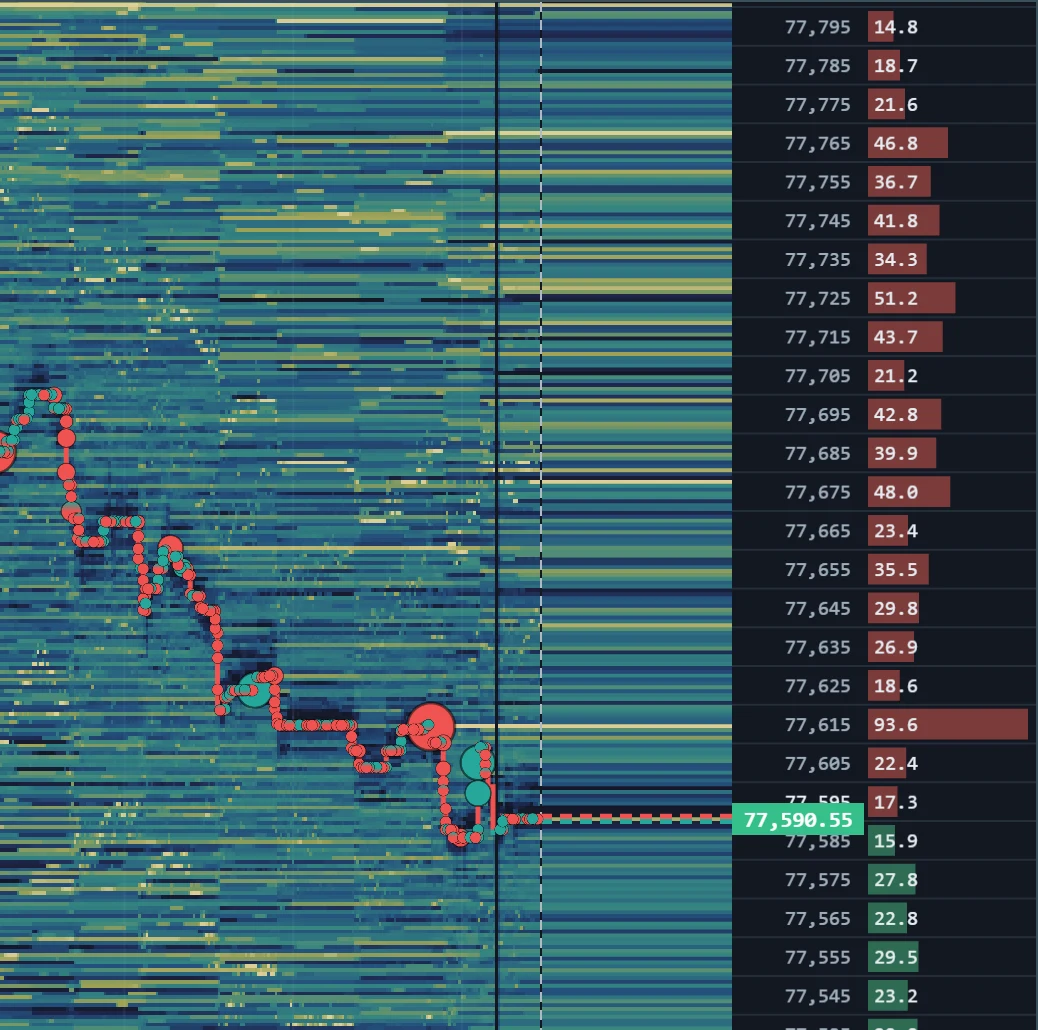
Market depth is how much size is resting in the order book beyond the best bid and ask — the limit orders waiting at each price above and below the market. A deep market can absorb large orders without moving much; a shallow one moves a long way on little size. Depth is the part of liquidity you cannot see from price alone.
What it looks like on the chart
The close-up above is the ladder beside a BTCUSDT heatmap: one row per price, and the size resting there as a bar and a figure — offers in red above the current price of 77,590.55, bids in green below it. Most rows carry between about 15 and 50 BTC, but at 77,615 the offer side holds 93.6, the largest row on screen — a wall just above price. Below, the bids at 77,585 and 77,575 hold 15.9 and 27.8. To the left, the same prices run back through time as the heat field, so a row that has been deep for a while shows as a long bright band.
How traders read it
- Where depth is thick, price tends to slow: a market order has to trade through all of it to pass.
- Where depth is thin, price can move quickly on little volume.
- Depth changes. Resting orders can be added and cancelled at any moment, so depth is a snapshot of intent. The heat field shows how long a level has really been there.
- Compare both sides. More size below price than above is resting demand; the reverse, resting supply.
On TapeHawk
The heatmap panel shows depth three ways: the heat field records it over time, the live-book band and the ladder show the book as it stands now, and the info bar reads Wall — the largest level — and Depth, the total size on screen or in the whole book TapeHawk receives. The ladder appears on heatmap panels at least 640 pixels wide. Book Imbalance turns the nearby depth on each side into one line.