What is liquidity in trading?
Liquidity is the size resting in the order book, ready to trade — the limit orders waiting at each price for someone to take them.
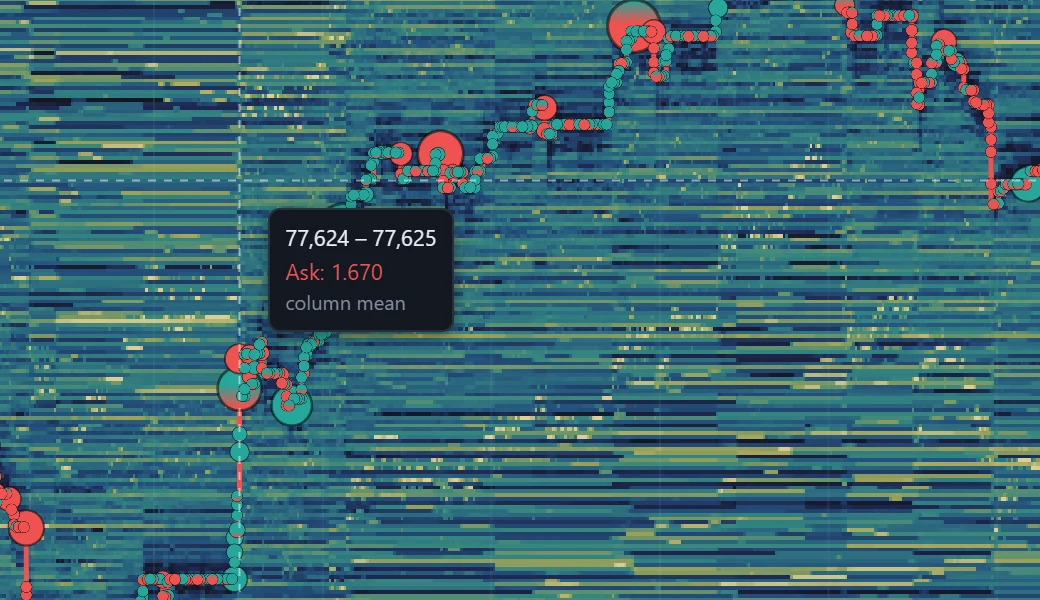
Liquidity is the size resting in the order book, ready to trade: limit orders waiting at each price for someone to take them. A liquid market has plenty of size near the current price, so orders fill without moving price much; an illiquid one has gaps, and a single order can push price a long way. In order-flow trading, liquidity is also a map — the prices where large size is waiting are the prices where moves tend to slow, stop or turn.
What it looks like on the chart
A liquidity heatmap colours every price at every moment by how much size was resting there, from dark for little to bright for a lot. In the close-up above, the pointer is on a cell and the read-out gives exactly what its colour stands for: the price band 77,624 – 77,625, Ask: 1.670 — 1.67 BTC offered there — and column mean, meaning the figure is the size averaged over the time that column covers. Bright horizontal lines are prices where size sat for a while; the trade bubbles along the price trace show where it was traded.
How traders read it
- Brighter is bigger. A bright band is a wall of resting size, and price often slows as it reaches one.
- Traded or pulled? A band that shrinks where trade bubbles print was consumed by aggressive orders. A band that vanishes before price arrives, with no bubbles there, was cancelled.
- Held or refilled. Price reaching a band, bubbles printing, and the band staying bright means the resting size held — or kept being refilled.
- Thin is not empty. A dark area with faint colour is thin liquidity; a column empty from top to bottom is missing data.
On TapeHawk
The heatmap panel is TapeHawk's liquidity view: the heat field records resting size over time, the live-book band and ladder on the right show the book as it stands now, and trade bubbles show what traded. Hovering a cell reads its price band, size and side. The colour scale is set by the panel's threshold and contrast. Liquidity Changes marks the largest walls when they stand and when they are pulled.