What is the value area in trading?
The value area is the band of prices around the point of control that holds most of the traded volume — 70% by convention.
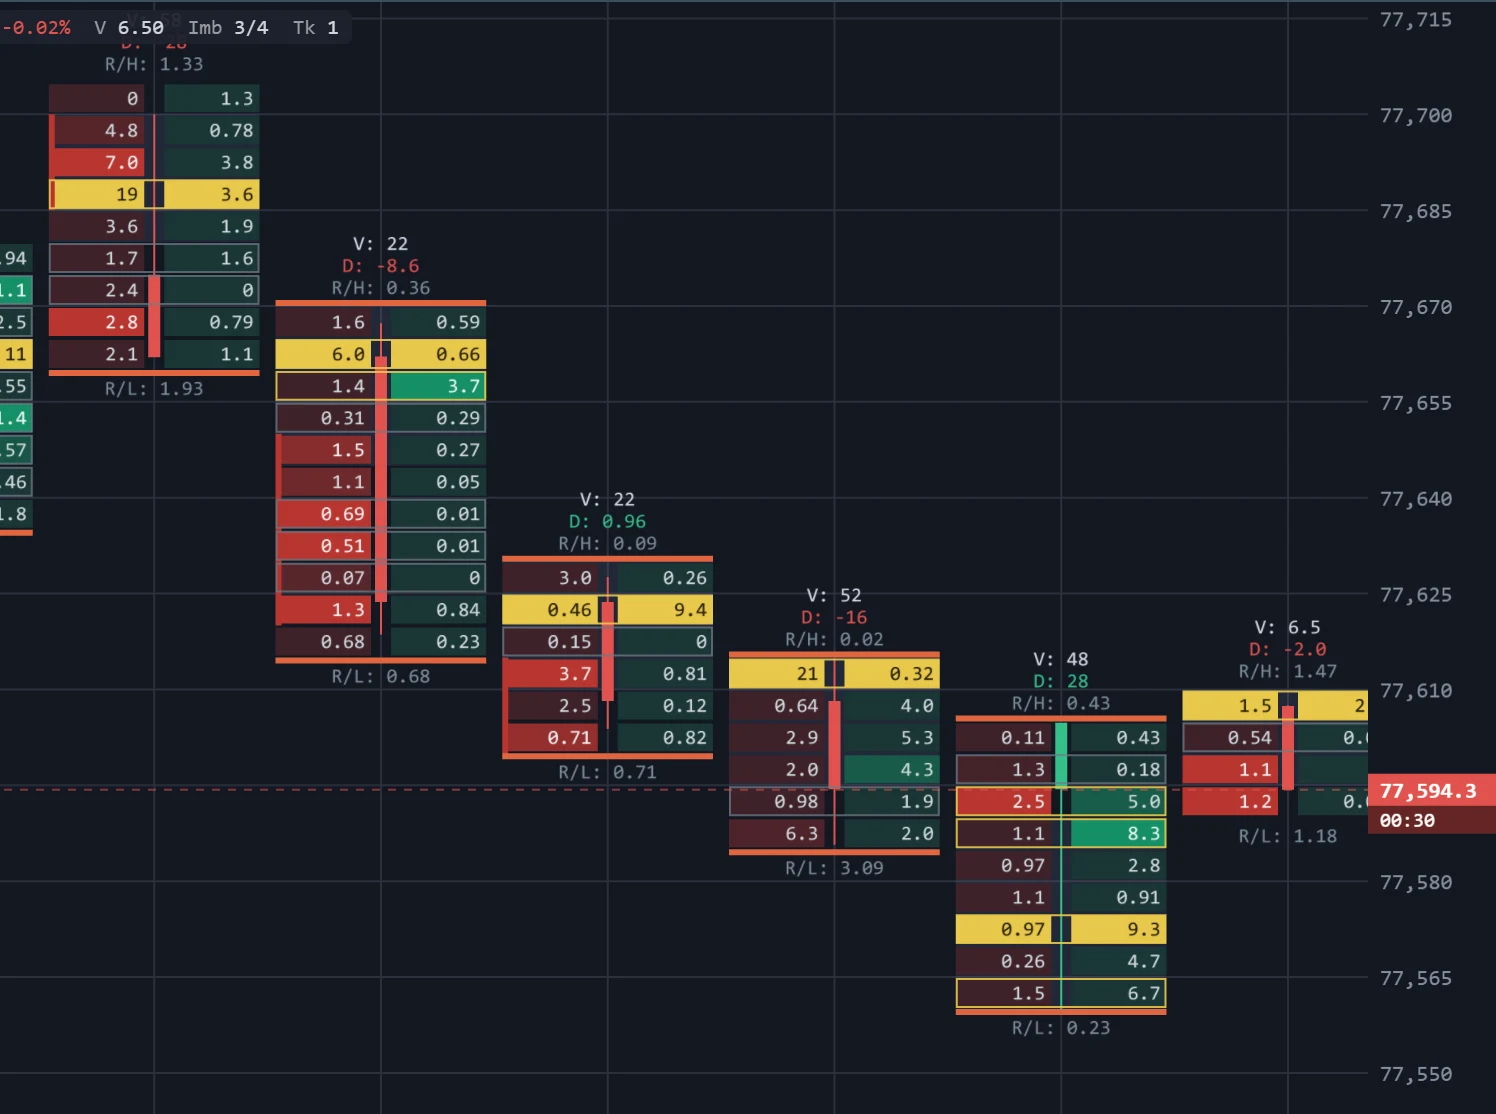
The value area is the band of prices around the point of control that holds most of the traded volume — 70% by convention. It comes from Market Profile, and it answers a simple question: where did the market do most of its business? Price inside the value area is trading where buyers and sellers agreed; price outside it is trading somewhere the market has not yet accepted.
What it looks like on the chart
On the footprint bars above, each bar carries its own value area: a soft band behind the rows where most of that bar's volume traded, starting at the bar's POC — the yellow row, such as 19 against 3.6 in the first bar, or 21 against 0.32 in the bar printed V: 52. Some rows are outlined: gold outlines are high-volume nodes, grey outlines low-volume nodes. The thin orange bars across the top and bottom edges mark unfinished auctions, where both buyers and sellers were still trading at the bar's extreme.
How traders read it
- The edges matter most. The value area high (VAH) and low (VAL) are where price leaves accepted territory. A move that goes outside and fails to hold usually returns into the value area — and often crosses it to the other edge.
- Opening outside the previous session's value area and staying there says the market has moved on to new prices.
- Width is information. A narrow value area is a market in tight agreement; a wide one is a market that traded a broad range of prices without settling.
On TapeHawk
The footprint's Value area band is on by default. It is built outward from the POC one level at a time, each step taking whichever neighbouring level traded more, until it holds the share set in Value area % (70% by default, from 30% to 95%) — so it is always one unbroken band. For a whole session rather than a single bar, the Volume Profile indicator draws the session's value area with its VAH and VAL across the chart, and TPO draws the time-based version of the same idea.