What is the POC (point of control)?
The point of control is the price that traded the most volume within a bar, a session or any chosen range.
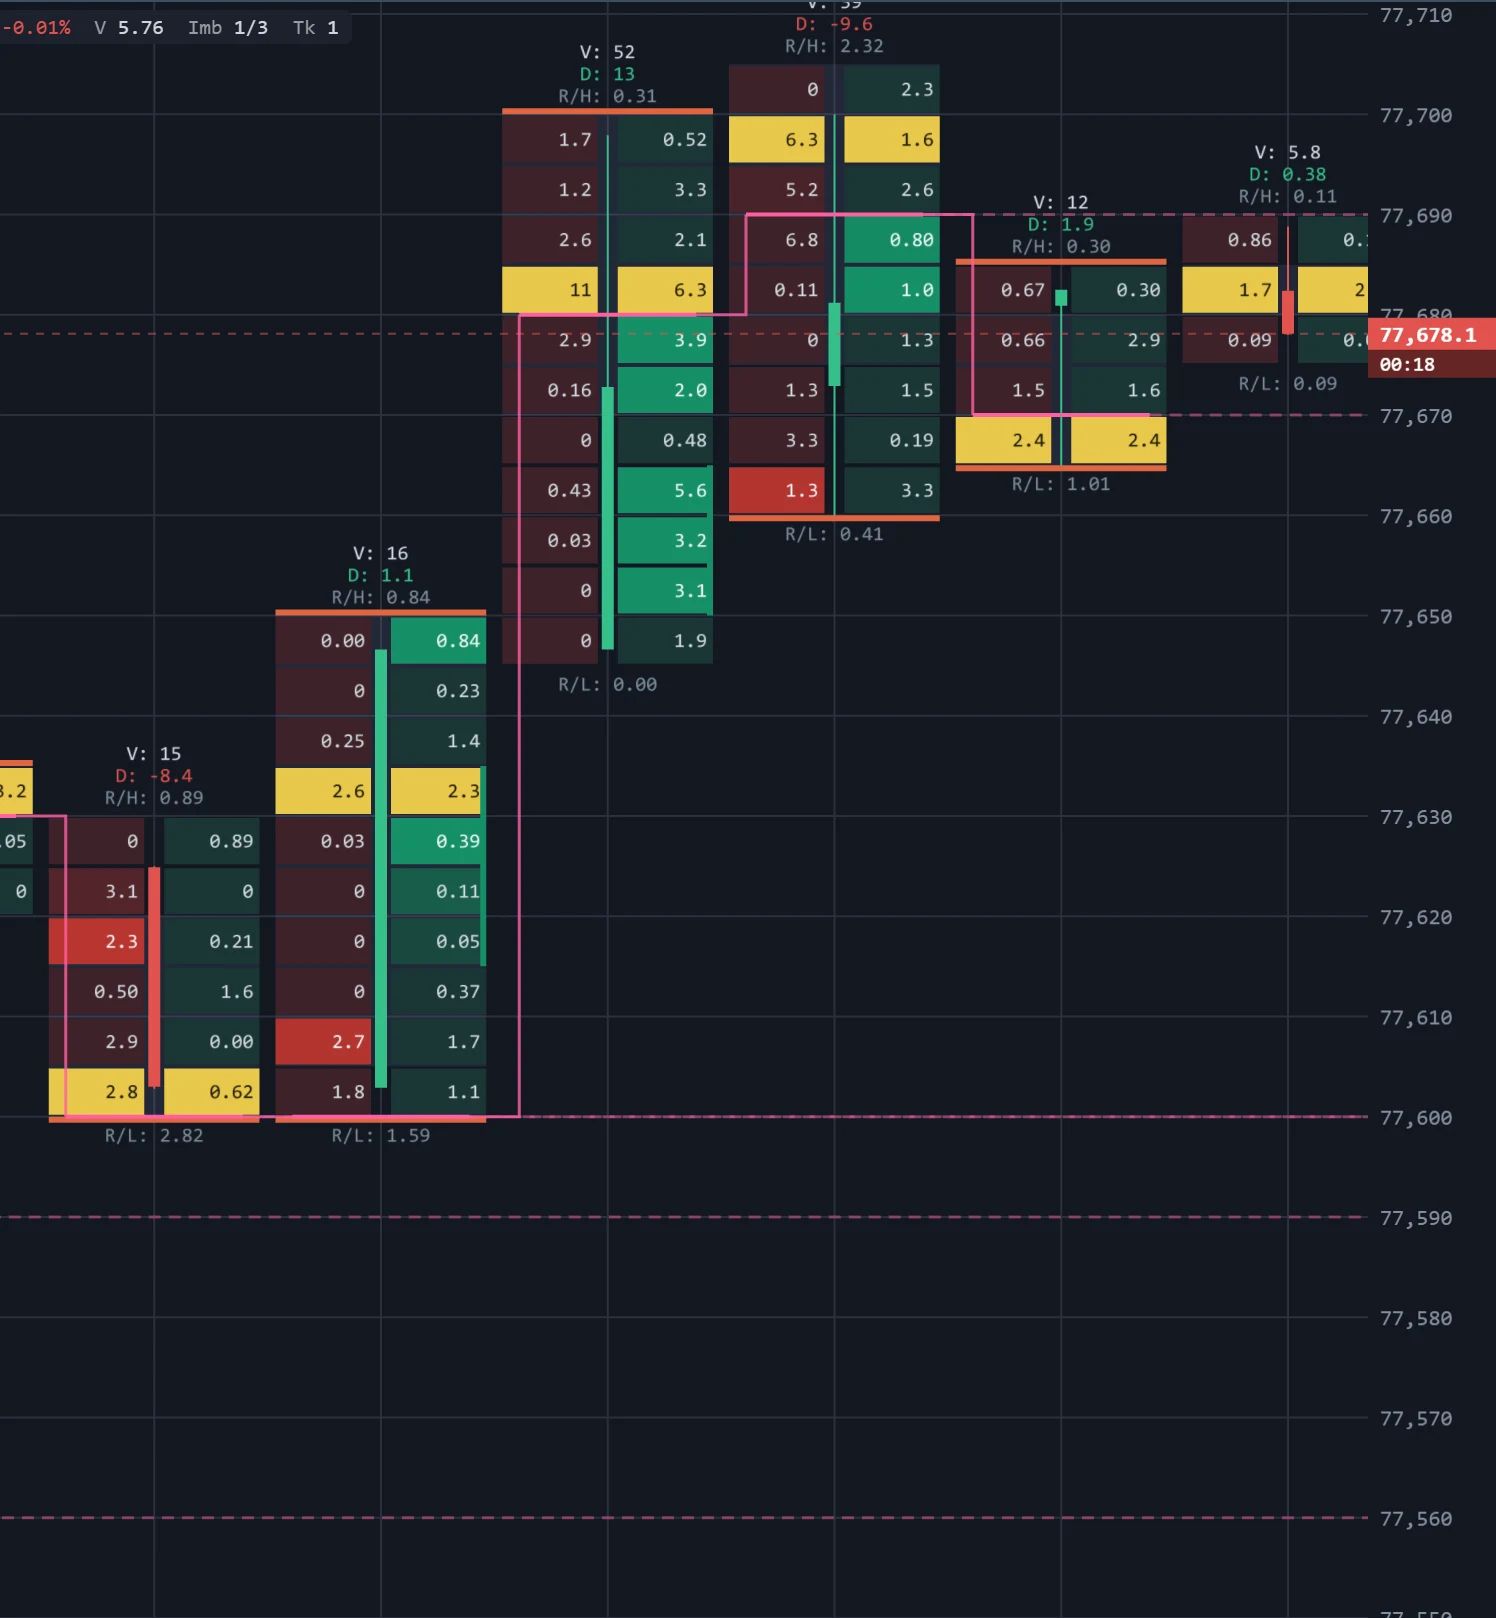
Split any stretch of trading by price and one row will hold more volume than the rest. That price is the point of control, or POC. It is where the market did most of its business over that stretch — the price buyers and sellers most agreed on. It can be measured for one bar, for a session, or for any range you choose.
What it looks like on the chart
In the footprint close-up above, the yellow row in each bar is the busiest row of the footprint. The VPOC indicator draws each bar's point of control as a pink stepped line: each bar keeps its own level, and a vertical at the bar boundary leads to the next. VPOC groups prices with its own price step, so its level matches the yellow row when the two steps agree and can sit a row or two away when they do not — in the bar marked V: 16, the yellow row is near 77,633 while the pink line runs at 77,600. A level no later bar has traded at again is naked, and a faint dashed line runs from it to the right edge; the dashed lines across the chart, at 77,690 and 77,600 among others, mark prices the market traded heavily and then left.
How traders read it
- Acceptance. The POC is the price the market accepted. A string of bars with their POCs close together describes value being built in one area.
- Migration. POCs stepping higher bar after bar mean the busiest trading is moving up with price. A candle that closes up while its POC sits at its low says most of its volume was done lower — the close may not be where the business was.
- Naked levels. Heavily traded prices that price has not returned to are often watched as references. Price does not have to come back to them; they are simply places where a lot of positions were opened.
Like every volume measure, a POC depends on the range you give it. The POC of one minute and the POC of a day answer different questions.
On TapeHawk
The footprint colours each bar's busiest row. The VPOC indicator draws the per-bar POC on candles, footprint or heatmap panels, and the volume profile indicators show the POC of a whole range together with its value area.