What is a volume profile?
A volume profile is a horizontal histogram of how much traded at each price over a session, showing where the market accepted price and where it passed through.
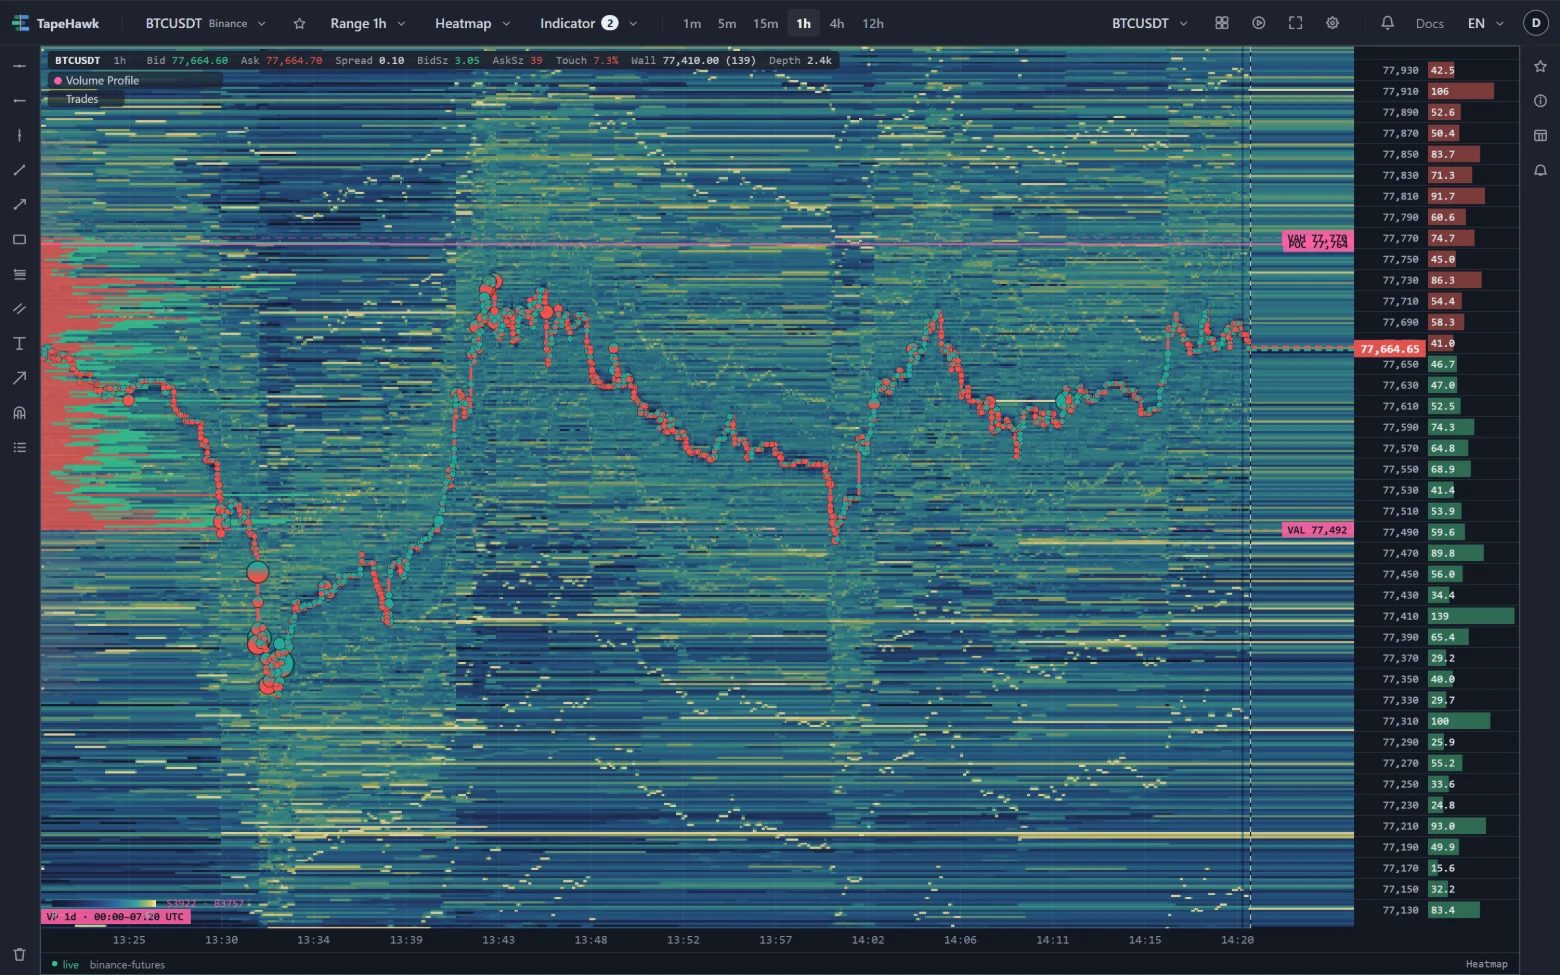
A volume profile shows how much traded at each price over a period, drawn as a horizontal histogram against the price axis instead of along time. Where a candle chart tells you when things happened, a profile tells you where: the prices the market accepted and traded at heavily, and the prices it passed through quickly.
What it looks like on the chart
On the one-hour BTCUSDT heatmap above, the profile sits on the left edge: one bar per price row, as long as the volume traded there during the day, split into selling at the bid and buying at the ask. The chip at the bottom names what it covers — VP 1d · 00:00–07:20 UTC, the session so far. Two labels on the right mark its key levels: the point of control (POC) near 77,764, the single busiest price, and the value area low (VAL) at 77,492, the lower edge of the band that holds most of the day's volume. Bars inside the value area are drawn in colour; outside it, in grey.
How traders read it
- The POC is the price the market agreed on most. When price drifts away and comes back, it often slows or turns there.
- The value area is where most of the business was done. Trading inside it is balance; leaving it and holding outside says the market is searching for a new price.
- Thick rows and thin gaps. High-volume prices tend to hold price when it returns; low-volume gaps between them are stretches price crossed fast and can cross fast again.
- Bid against ask within a row shows which side was the aggressor at that price.
On TapeHawk
The Volume Profile indicator draws the session's profile — a day by default, or a 4- or 8-hour block, a week or a month, on the timezone you pick — with its POC, value area high and low, and optional high- and low-volume node bands. It can also draw one profile per session, carry a finished session's untouched levels to the right, and show how the POC and value area developed bar by bar. It is built from stored order flow, so it is available on the symbols TapeHawk records, and it reaches back 30 days.