What is an imbalance in a footprint chart?
An imbalance is a price where aggressive buying or selling was several times larger than the other side, compared diagonally on a footprint.
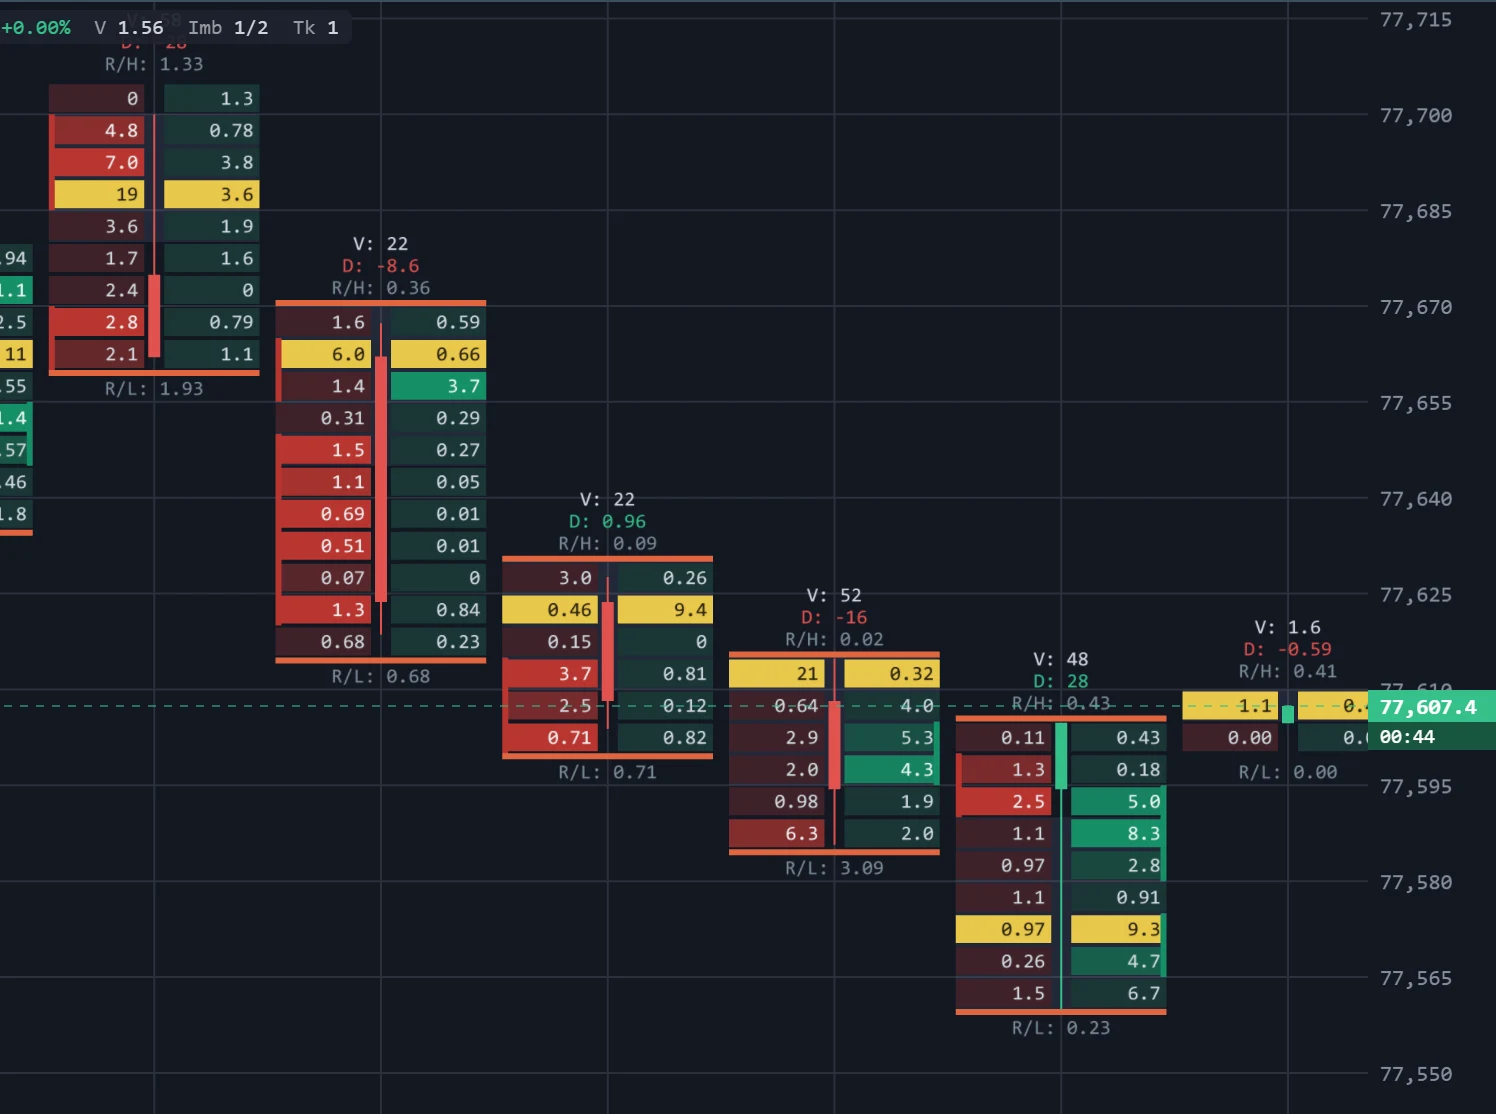
An imbalance is a price where one side of the trading was far larger than the other. On a footprint, every price row of a bar splits its volume into what sold on the bid and what bought on the ask, and an imbalance is a row where one of those numbers dwarfs its counterpart — buyers overwhelming sellers at that price, or the reverse.
What it looks like on the chart
The footprint above colours each imbalanced cell: green where buying won, red where selling won, more saturated the larger the gap. In the bar printed V: 48, D: 28, the ask cells read 5.0 and 8.3 while the bid cells one level below them read 1.1 and 0.97 — buying several times the selling it met, so both ask cells light up green. In the bar printed V: 22, D: -8.6, the bid column carries a run of red cells from 1.5 down to 1.3 against ask cells of 0.27, 0.05 and 0.01.
The comparison is made diagonally, the way orders actually meet: buying at a price is set against selling one level below, and selling against buying one level above. Comparing the two halves of the same row would pair two unrelated events.
How traders read it
- An imbalance is aggression, not direction. It says which side was in a hurry at that price, not where price goes next.
- Where it sits in the bar matters. Buying imbalances at the bottom of a bar are buyers stepping in; the same imbalances at the top, with price failing to go higher, are buyers running into a wall.
- One cell is a detail, several in a row are a statement. A run of imbalances on the same side is a stacked imbalance, and it carries far more weight than a single coloured cell.
On TapeHawk
The footprint colours imbalances by default with the Saturation colour scheme and counts them in the Imb read-out of the info bar. The threshold is the Imbalance ratio — how many times larger one side must be, 3× by default (the chart above uses 2×). An empty opposite cell inside the bar's range counts as the strongest imbalance there is; the top bid cell and bottom ask cell of a bar have no diagonal neighbour and are never marked.