What is the aggressor in a trade?
The aggressor is the side of a trade that crossed the spread: a buyer paying the offer or a seller hitting the bid, against a passive limit order.
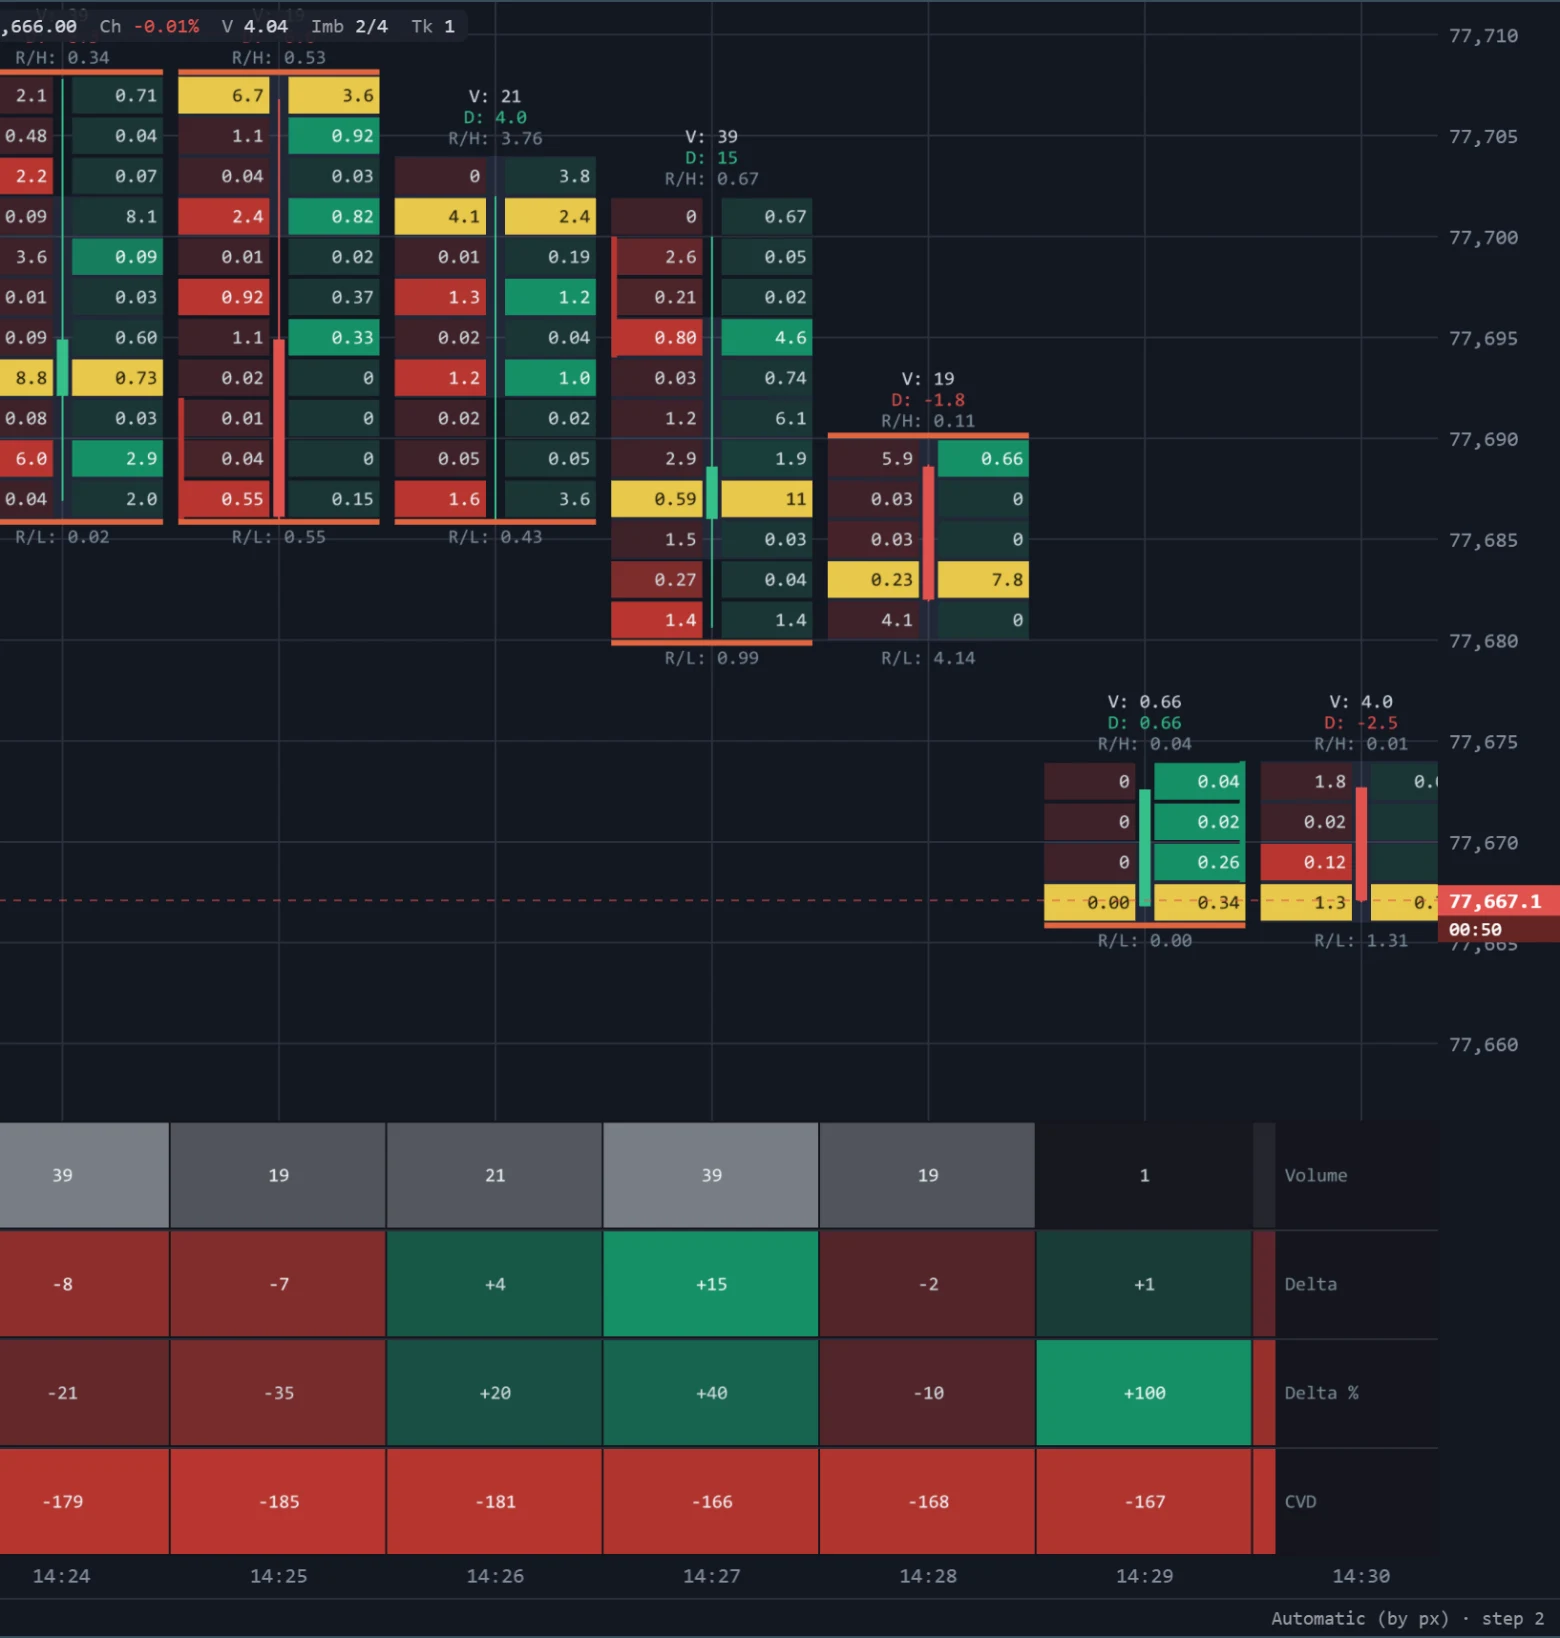
The aggressor is the side of a trade that crossed the spread. Every trade has two parties: one had a limit order resting in the book, the other sent an order that took it. A buyer paying the offer is an aggressive buyer; a seller hitting the bid is an aggressive seller. The resting side is passive. Order flow is, above all, the study of who was aggressive, where, and whether it moved price.
What it looks like on the chart
The footprint above splits every price row into volume sold at the bid (left cells) and bought at the ask (right cells) — the aggressive sellers and the aggressive buyers at that price. The statistics grid underneath adds them up per bar. The bar at 14:27 took +15 of net aggressive buying on a volume of 39 — +40 in the Delta % row, buyers 40 points ahead. The bar at 14:25 was the opposite: -7, or -35%. The last bar's +100 means every contract in it was bought by aggressive buyers, on a volume of just 1. The CVD row, -179 rising to -167, is the running total of all of it.
How traders read it
- Aggression moves price — until it does not. Aggressive buying that lifts price is demand winning; aggressive buying that fails to lift it is being absorbed by passive sellers.
- The passive side is patient. A large limit order waiting at a level is often the stronger hand; the aggressor is the one in a hurry.
- Delta — aggressive buying minus aggressive selling — is the aggressor count reduced to one number per bar.
On TapeHawk
Every trade TapeHawk receives carries its aggressor side from the exchange. The footprint shows it per price as bid and ask cells, the Statistics grid per bar as volume, delta, delta % and CVD, and the heatmap's trade bubbles as the teal (bought) and red (sold) share of each bubble. CVD and V-Delta follow the aggressive balance over time.