What is a stacked imbalance?
A stacked imbalance is a run of consecutive price levels all imbalanced the same way — one side overwhelming the other across a stretch of prices.
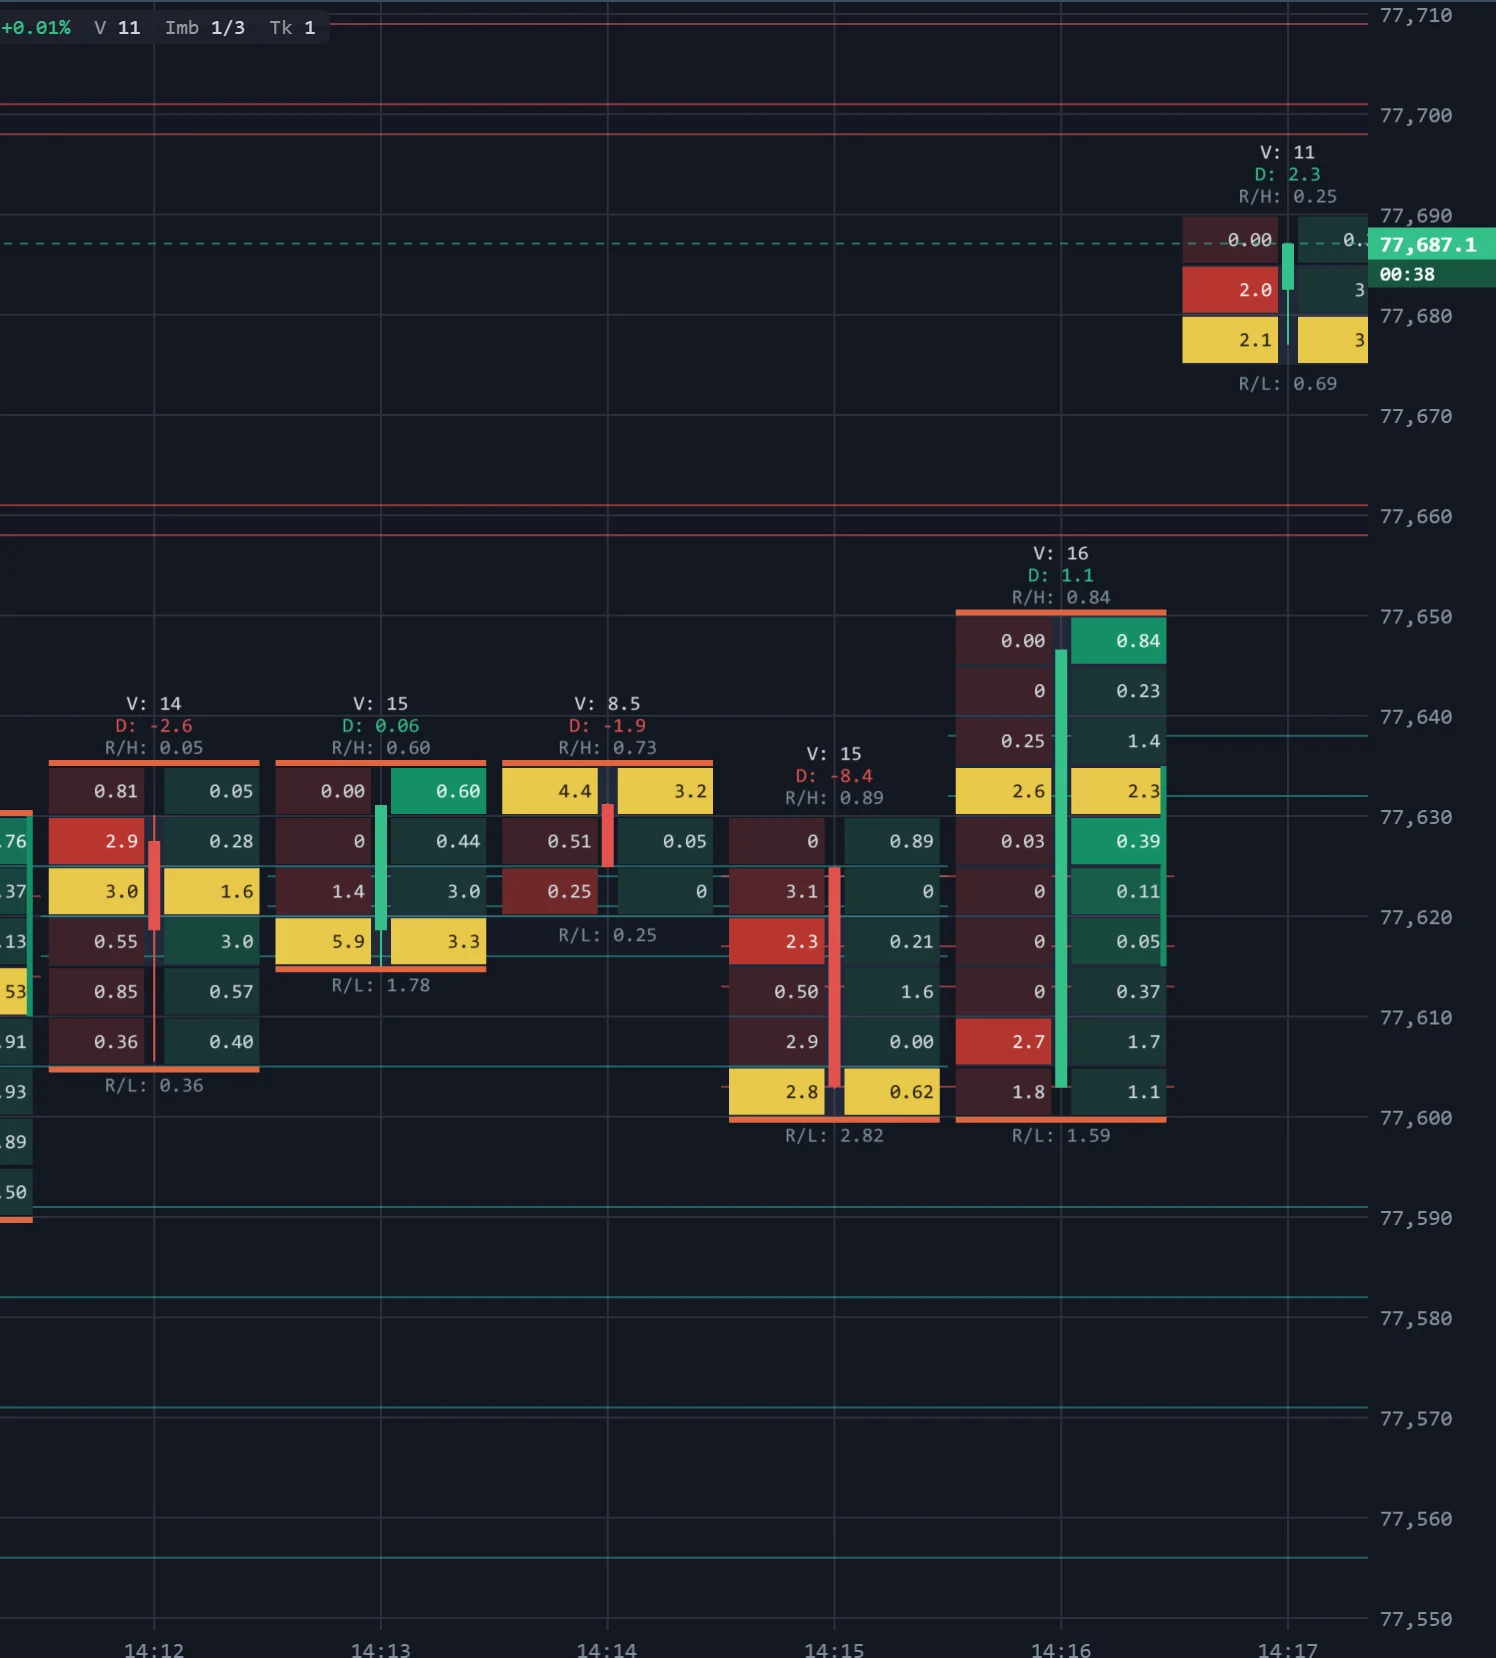
A stacked imbalance is a run of consecutive price levels that are all imbalanced the same way — three, four or more prices in a row where buyers overwhelmed sellers, or sellers overwhelmed buyers. One imbalanced price can be a single large order; several stacked together describe one side taking control across a whole stretch of the book.
What it looks like on the chart
The chart above is a footprint with S/R Zones switched on — zones built from stacked imbalances. The thin red bands above price, near 77,700 and 77,660, are resistance: runs of selling imbalance that absorbed a lot of one-sided volume at those prices. The teal bands below — around 77,640, 77,590 and 77,570 — are support, left by runs of buying imbalance. Each band runs on to the right between the same two prices until price closes through it or the bars that built it age out.
On the footprint itself a stacked run is marked by a solid bar down the outer edge of the column: on the left for bid imbalances, on the right for ask imbalances.
How traders read it
- A stack of buying imbalances is buyers lifting level after level without sellers catching up. Price returning to that stack is testing whether those buyers are still there, which is why it is read as support.
- A stack of selling imbalances is the mirror image, read as resistance.
- Size matters more than count. A price where fifty thousand bought and fifty thousand sold is balance, however busy. What makes a level is the excess of one side over the other.
- A stack that breaks — price closing straight through it — says the side that built it has gone.
On TapeHawk
The footprint marks stacked runs with Stacked imbalances (3 levels by default, or off). The S/R Zones indicator goes further: it measures how much the winning side put through each run beyond what the other side did, adds those amounts up across the bars still in memory, and draws a zone where they reach a large total. The heavier the band, the more one-sided volume it absorbed. It is drawn on footprint panels at 1m, 5m, 15m and 1h, and can send an alert when a new zone forms.