What is relative volume (RVOL)?
Relative volume is a bar’s traded volume as a multiple of what the bars before it usually traded — 1.0 is normal, 2.0 twice as busy.
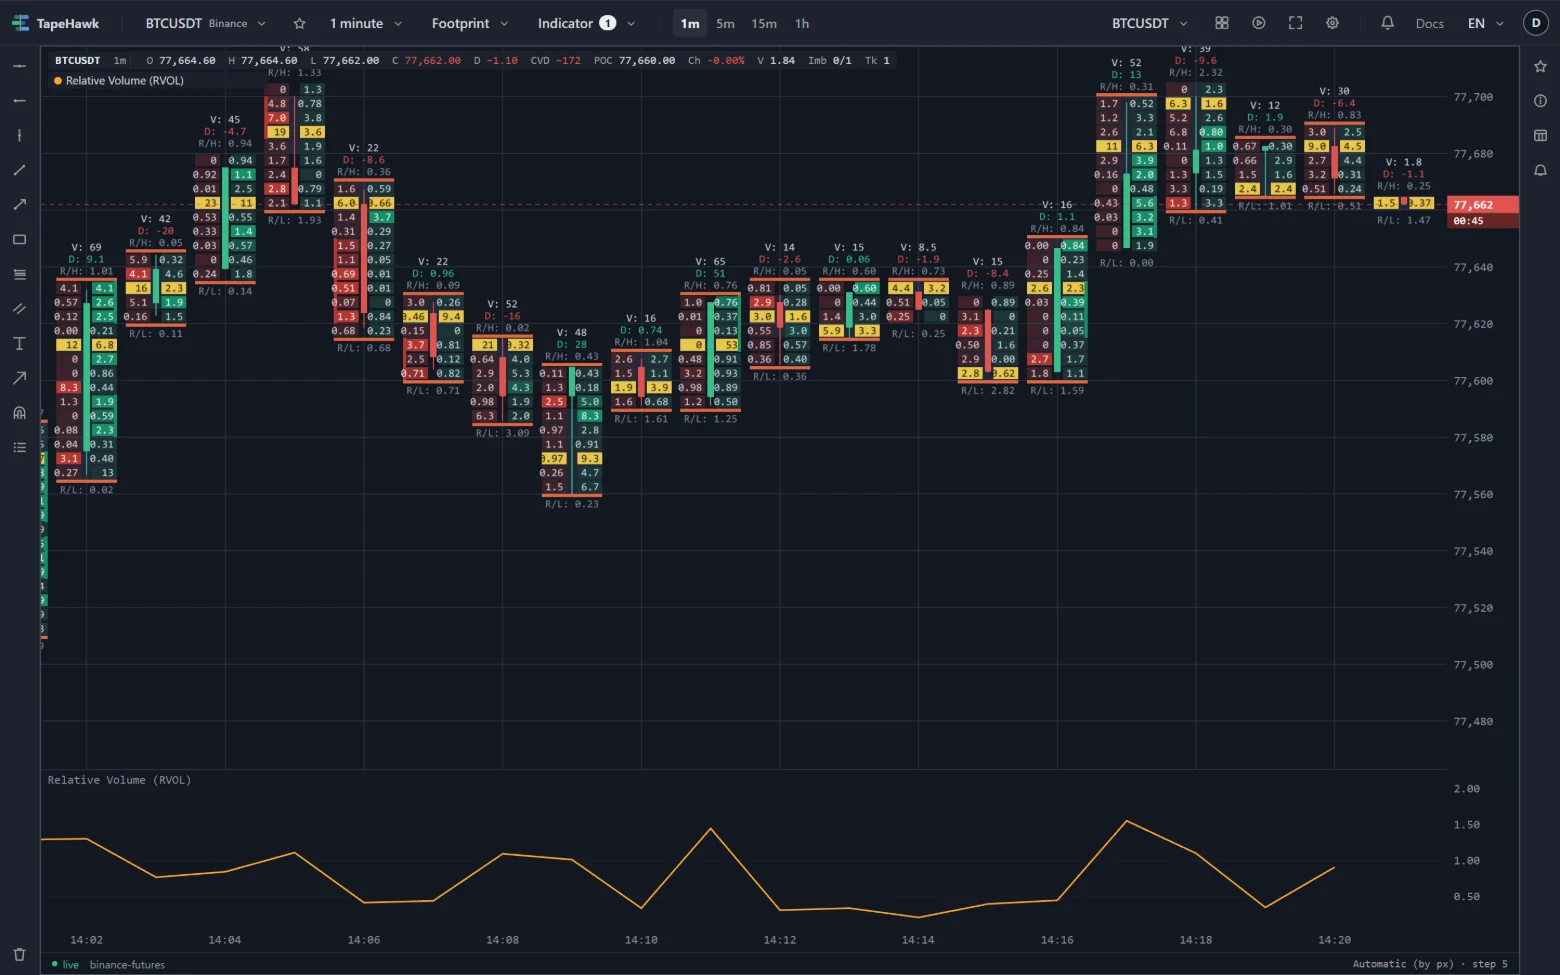
Relative volume (RVOL) is a bar's traded volume as a multiple of what the bars before it usually traded. At 1.0 the bar traded as much as normal; at 2.0, twice as much; at 0.5, half. Raw volume cannot tell you whether a bar was busy — a quiet minute on BTC trades more than a busy hour on a small coin — but relative volume can, because it compares each market with itself.
What it looks like on the chart
The band under the one-minute BTCUSDT footprint above is the Relative Volume (RVOL) line. Most of the stretch runs between about 0.5 and 1.1 — ordinary participation. Two peaks stand out: about 1.4 at 14:11, on the bar printed V: 65, D: 51, a burst of buying; and about 1.55 at 14:17, on the bar printed V: 52. The troughs near 14:10, 14:14 and 14:19 dip to roughly 0.4 — minutes when the market all but stopped.
How traders read it
- Spikes mark minutes where participation jumped. Where they happen matters: at a level, after a long quiet stretch, at the end of a trend.
- Confirmation. A breakout bar with high relative volume has participation behind it; the same breakout on an ordinary reading has less.
- Quiet before a move. Stretches with the line below 1.0 often come before a market picks a direction.
- Direction is not in it. RVOL says how loud a bar was, not which side was loud — pair it with delta or CVD.
On TapeHawk
The Relative Volume (RVOL) indicator draws each bar's volume as a multiple of a baseline of the bars before it — never including the bar itself, so a burst is compared with the market that came before it. On candles and footprint panels it works at 1m, 5m, 15m and 1h; on a heatmap each value covers one minute. Each value arrives once the bar has closed. For bursts shorter than a minute, V-Delta on a heatmap follows the flow trade by trade.