What is VWAP (volume-weighted average price)?
VWAP is the average price paid since a starting point — usually the start of the day — with each price weighted by the volume traded at it.
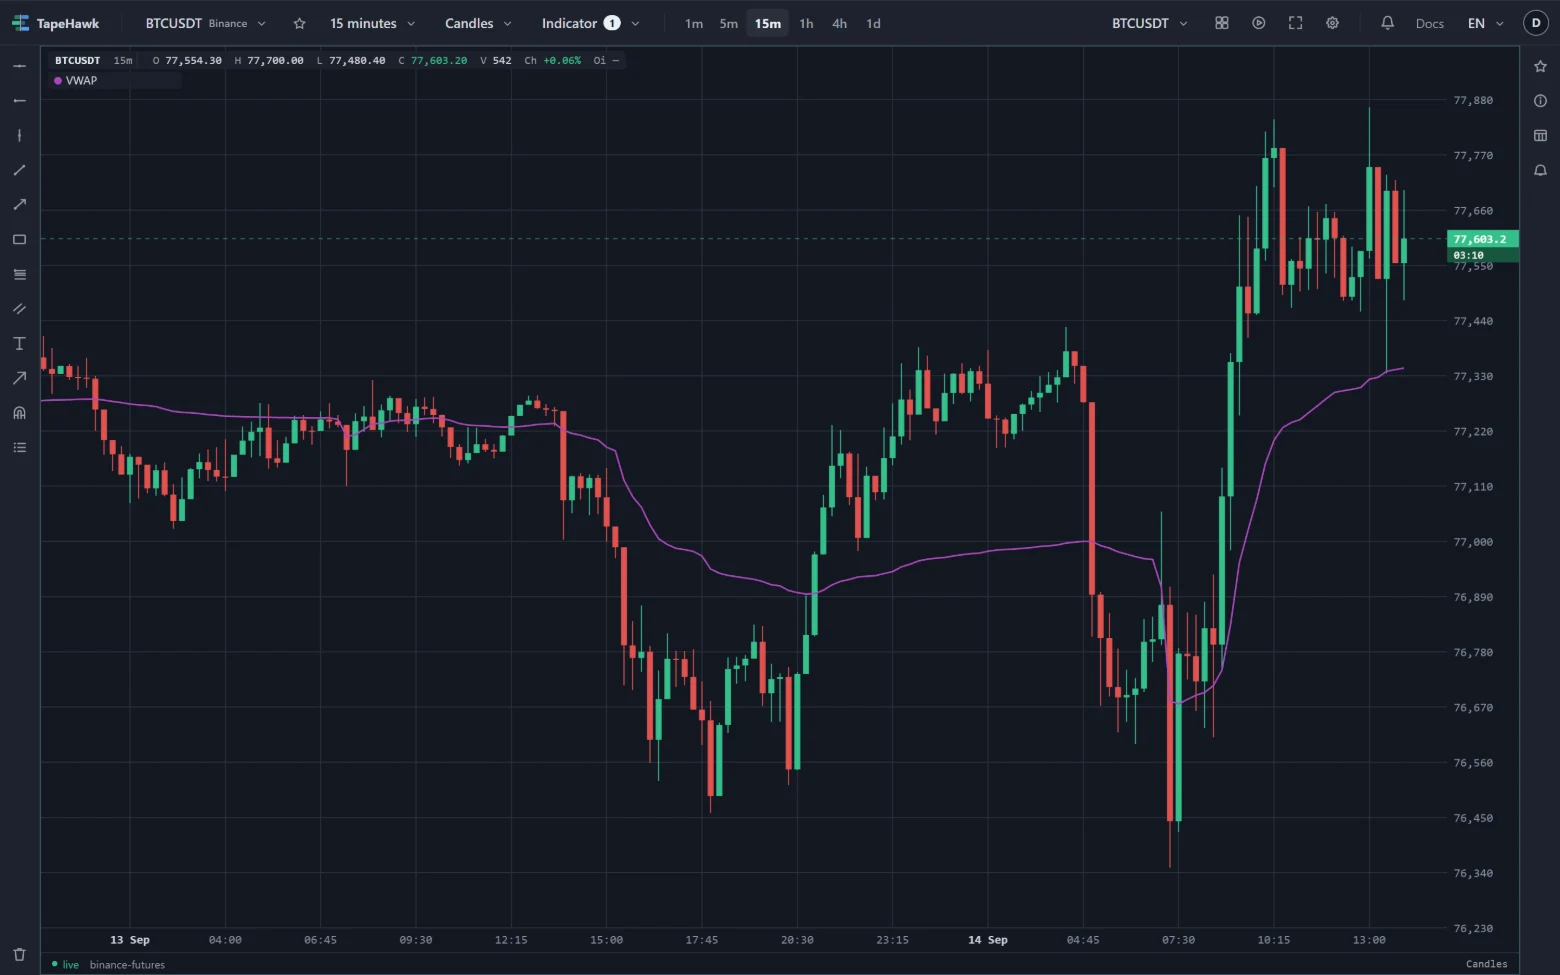
VWAP — the volume-weighted average price — is the average price paid since a starting point, with each price counted as many times over as the volume that traded at it. A candle with heavy volume pulls the line towards its price; a quiet candle barely moves it. Because large participants judge their fills against it, VWAP is one of the most watched lines on an intraday chart.
What it looks like on the chart
The chart above shows BTCUSDT 15-minute candles with VWAP drawn as the purple line. The axis is in local time seven hours ahead of UTC, so the line restarts at 07:00 on the axis — midnight UTC. On 14 September it begins right at the price of the day's first candle, near 76,700, just as BTC was bottoming, then climbs steadily as the rally's volume builds behind it, reaching about 77,330 while price trades above 77,600. On the previous day the line sat above most of the candles through the afternoon sell-off and flattened as price ranged.
How traders read it
- Price above VWAP means the market is trading above the average price paid so far today — buyers have been paying up. Below it, the reverse.
- A reference level. In a quiet market price often returns to VWAP and reacts there.
- Trend or range. On a trending day price can stay on one side of VWAP for hours while the line slopes after it; on a range day the line goes flat and price crosses it again and again.
- Early in the day the line moves easily because little volume stands behind it; it carries more weight as the day goes on.
On TapeHawk
The VWAP indicator restarts at 00:00 UTC every day by default, whatever timezone the axis shows, or can run from the oldest candle loaded. It adds each candle's typical price — the average of its high, low and close — weighted by its volume. On 1d and longer timeframes every candle starts a new day, so use a shorter timeframe. For a VWAP anchored to another timezone or to trading hours, with standard-deviation bands, turn it on inside the Volume Profile indicator, which computes it from the volume at each traded price.