Markets
BNBUSDT order flow: delta, market buying and selling
On 4 October 2026, BNBUSDT closed at 795.86 (+1.07%). Market buy orders took 48.9% of the 378.35k BNB traded, for a delta of -8.59k BNB across 718,489 trades.
The heaviest aggressive buying came in the hour from 22:00 UTC, with a delta of +3.97k BNB.
The heaviest aggressive selling came in the hour from 14:00 UTC, with a delta of -5.46k BNB.
Over the last 30 whole days, market buyers outweighed sellers on 6 of them.
Delta by hour on 4 October 2026 (UTC)
Each bar is one hour: green above the line when market buying outweighed selling, red below when selling did.
Live chart
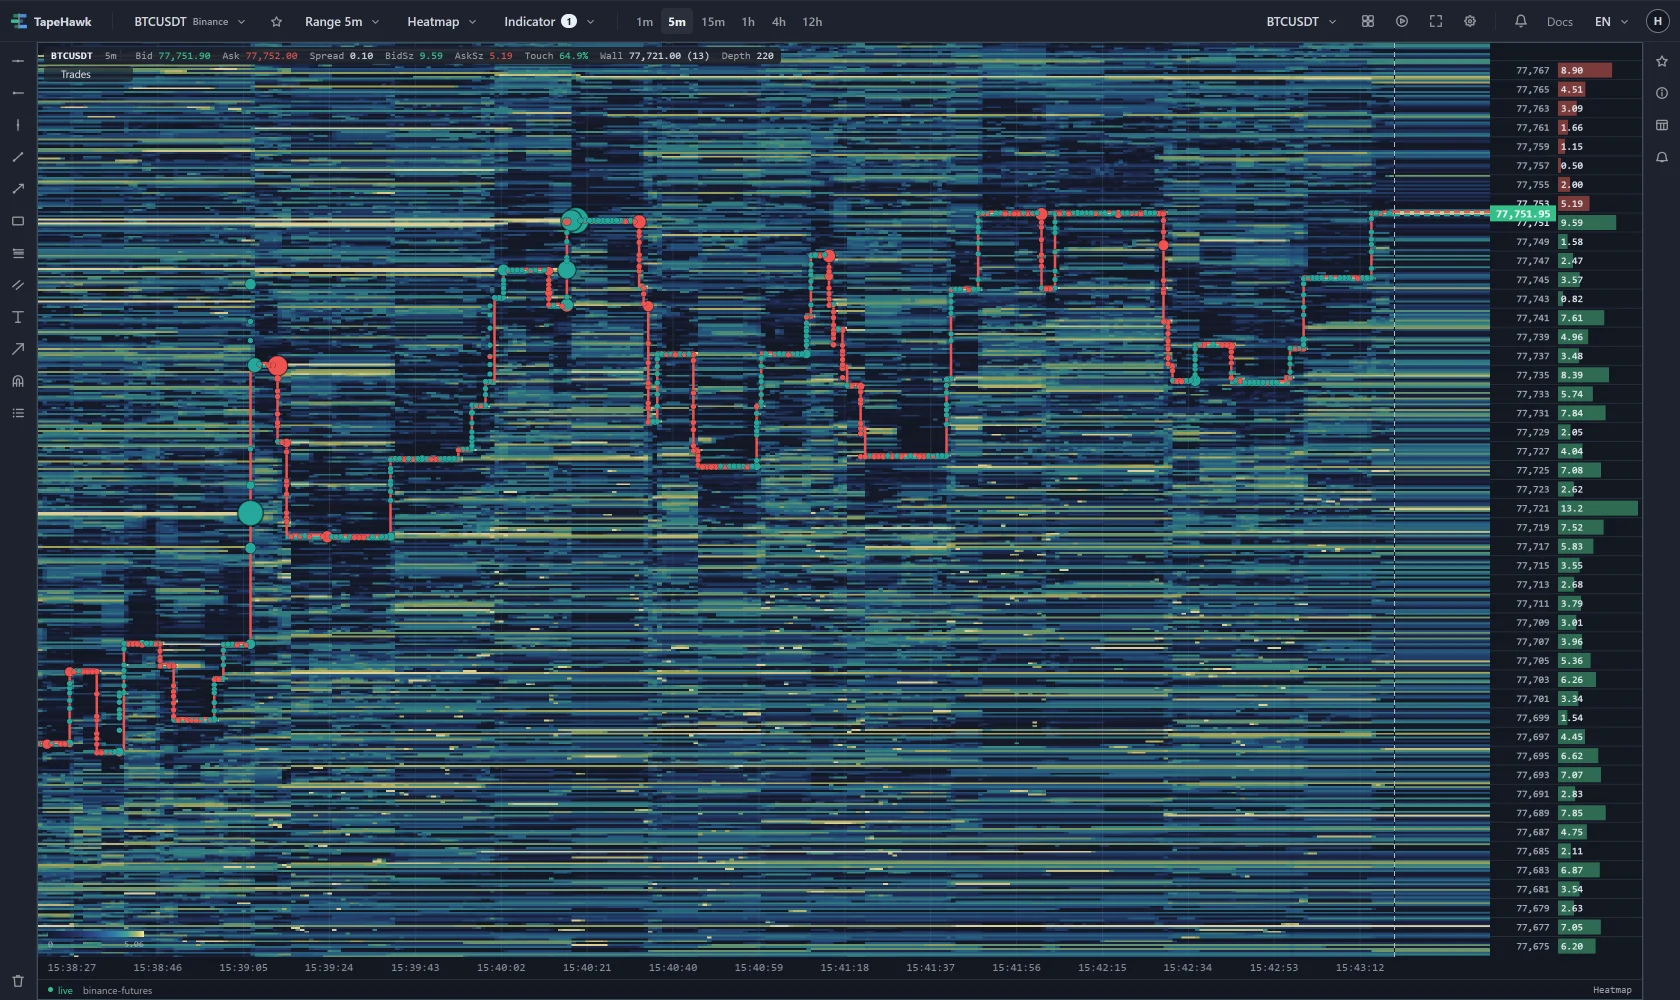
Live Binance Futures data, streamed only while the chart is open.
The last 30 days
| Day | Close | Change | Delta | Market buys | Volume (USDT) | Trades |
|---|---|---|---|---|---|---|
| 4 Oct | 795.86 | +1.07% | -8.59k | 48.9% | 299.05m | 718,489 |
| 3 Oct | 787.43 | +2.45% | +1.7k | 50.2% | 322.11m | 744,979 |
| 2 Oct | 768.60 | -0.46% | -543.02 | 49.9% | 368.15m | 1,057,209 |
| 1 Oct | 772.15 | +0.31% | -10.66k | 48.2% | 227.66m | 874,825 |
| 30 Sept | 769.73 | +1.39% | +2.91k | 50.4% | 314.05m | 1,175,474 |
| 29 Sept | 759.20 | -0.67% | -11.26k | 48.7% | 320.51m | 1,118,998 |
| 28 Sept | 764.33 | -1.92% | -33.24k | 46.7% | 386.35m | 1,420,678 |
| 27 Sept | 779.33 | +0.72% | -4k | 49.3% | 229.39m | 697,159 |
| 26 Sept | 773.74 | -0.49% | -4.7k | 48.8% | 156.92m | 495,986 |
| 25 Sept | 777.53 | +0.05% | -29.33k | 46.6% | 333.52m | 998,137 |
| 24 Sept | 777.14 | +1.22% | +9.96k | 51.0% | 390.89m | 1,190,298 |
| 23 Sept | 767.76 | -2.68% | -49.35k | 46.5% | 547.84m | 1,474,945 |
| 22 Sept | 788.87 | -1.36% | -16.24k | 48.8% | 552.18m | 1,420,946 |
| 21 Sept | 799.78 | +3.45% | -65.55k | 46.8% | 818.45m | 2,107,581 |
| 20 Sept | 773.12 | +1.39% | +1.83k | 50.2% | 443.22m | 1,198,809 |
| 19 Sept | 762.52 | +0.08% | -2.11k | 49.8% | 355.31m | 994,497 |
| 18 Sept | 761.92 | +3.12% | -20.54k | 48.6% | 556.47m | 1,665,538 |
| 17 Sept | 738.89 | +1.69% | +10.68k | 51.3% | 311.17m | 1,018,870 |
| 16 Sept | 726.59 | +1.97% | -2.03k | 49.8% | 325.82m | 1,147,451 |
| 15 Sept | 712.54 | -1.15% | -11.92k | 48.8% | 365.75m | 1,256,133 |
| 14 Sept | 720.82 | +0.57% | -26.27k | 47.4% | 369.29m | 1,141,807 |
| 13 Sept | 716.74 | -1.54% | -1.95k | 49.7% | 233.55m | 726,845 |
| 12 Sept | 727.96 | +0.12% | -8.23k | 48.7% | 239.74m | 713,144 |
| 11 Sept | 727.10 | +2.53% | -11.81k | 49.1% | 462.34m | 1,441,342 |
| 10 Sept | 709.13 | -1.89% | -29.38k | 47.5% | 413.58m | 1,308,235 |
| 9 Sept | 722.77 | -3.95% | -39.33k | 46.8% | 452.54m | 1,358,758 |
| 8 Sept | 752.46 | +1.63% | -26.68k | 48.1% | 537.44m | 1,562,312 |
| 7 Sept | 740.39 | -1.74% | -23.9k | 47.5% | 355.03m | 1,060,563 |
| 6 Sept | 753.48 | -1.76% | -27.38k | 47.9% | 504.03m | 1,226,323 |
| 5 Sept | 766.95 | +6.26% | +40.39k | 51.6% | 948.32m | 2,065,993 |
Source: Binance Futures hourly klines. Delta is market-buy volume minus market-sell volume, in BNB. Days run 00:00–24:00 UTC and are shown once closed.
What the daily recap recorded
TapeHawk's daily order flow recap follows BNBUSDT. These are the marks its indicators drew on 4 October 2026.
| Indicator | Buy | Sell |
|---|---|---|
| Big Trades | 1 | 6 |
| bookimbalance | 61 | 161 |
| liqchanges | 3,273 | 3,530 |
| Market Volume Imbalance | 165 | 225 |
| Stop Runs | 2 | 3 |
Where the marks clustered
- 788.91 – 789.72: 265 marks
- 793.76 – 794.56: 241 marks
- 783.26 – 784.07: 214 marks